Price action trading is the favorite method for many traders, but few do it right!
Today I will describe the price action trading strategy that we use successfully in the Academy. This is a free lecture, it’s not going to be part of any of our trading courses.
We will keep creating lectures to share with you the strategies and trading systems that we use in the Academy. Now, as a price action trader, I’m always looking for volatile assets such as Bitcoin. And yesterday I had some great profits with the Bitcoin as it passed again the $10,000, which is an important round number for the price action traders, and it is already above much higher.
In this lecture, I will do a quick overview of the price action strategy that I’m using and you will be able to apply it at the end of the lecture. So all price action traders use different methods, different drawing tools, indicators, different trading platforms, different price action patterns, but what’s common for everybody is the price.
This is why it’s called price action trading because we are trading based on what the price forms. For the very beginner traders, what usually we have on the chart are the candlesticks or the bars.
The TradingView platform is suitable for price action trading strategies
The candlesticks are bars that are formed from the price. The most common outlook is the candlesticks because they give us the idea when the market was positive and when the market was negative. For example, the long red candlestick below shows that it was a negative hour for the Bitcoin.
And then the positive green bar shows that it was a very positive hour for the Bitcoin. Why do I say an hour? Because one candlestick or one bar represents one hour’s time. This presentation of the price allows us to draw different lines and to use different indicators.
I will explain to you what I use for my price action trading strategy which could apply not only for the Bitcoin but for any other trading asset that you want to trade with. For example, if you are a fan of the currency pairs, you can do price action Forex trading.
Or if you are a fan of stocks, you can do stock trading as well. Anything on the market that moves could be traded with price action strategy, and, of course, we need the brokers to offer it and to provide it to have access to trade with it.
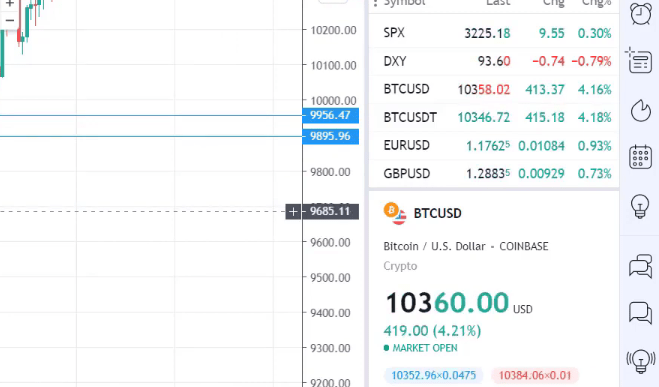
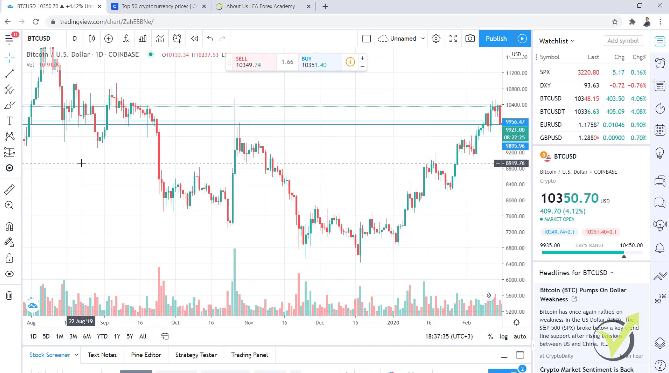
For the purpose of this lecture, I have selected to use TradingView which is a great online platform for trading so many different assets.
The trend is vital for the price action trading strategies.
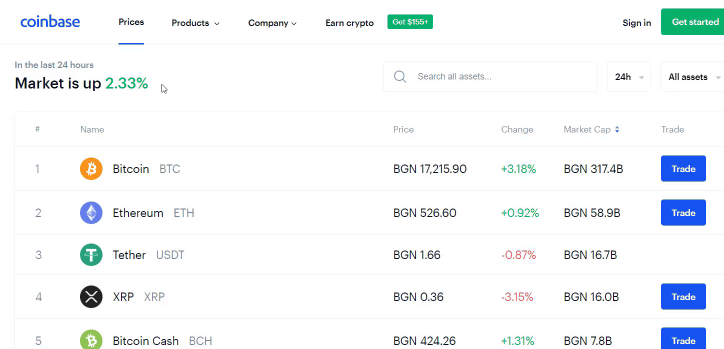
But I’m not related to the platform so don’t take it as a recommendation. I simply combine it when I do cryptocurrency trading or investing and I do the analysis over TradingViewing, in this case for Bitcoin. I have been trading in Coinbase recently, a great cryptocurrency exchange where you can trade so many different cryptocurrencies.
will start from scratch for those who don’t have any experience in trading.
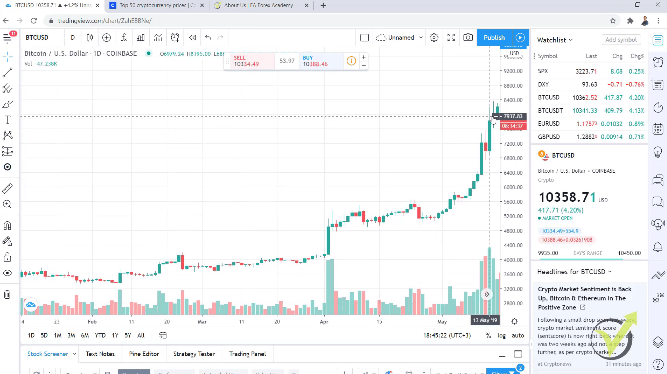
I will go to the daily chart and I will select the period between August 2019 and December 2019.
The first important thing about price action trading is the trend.
The price has the tendency to trend. What does it mean to trend? To go in one direction for a longer period of time. For this period the price was falling. There are some periods when the price is going up, down, up, up again, down. But overall, the price goes down.
The Price action patterns applicable to any asset of your choice
In this case, it dropped from 12,290 down to 6,500 and something. And the Bitcoin lost 2 times its value. One more time, for this price action strategy, I will stick to the Bitcoin because recently I trade it a lot and it’s very volatile.
You can apply the strategy to any other trading asset, Forex, crypto, commodity, stocks, whatever you want to trade. And what is the trend? The trend is defined as a series of higher highs and higher lows.
This means that when we have consecutive lower highs and consecutive lower lows, we will have a downtrend. In this case, we have such a downtrend.
So, one more time, in price action trade we say that we are in a downtrend when we have a series of lower highs and a series of lower lows.
The very same thing on the other side, when the price is going up, when we have a series of higher highs and a series of higher lows, this period is an uptrend.
Most price action traders want to trade with the direction of the trend.
CFD trading is when we do Forex price action
And why is that? Because we have a higher chance to be on the profitable side. For example, if we buy, we have a higher chance to reach our targets because we are in an uptrend. Most of the people are buying at this moment. And when we are in a downtrend, it means that the people are selling.
And no matter why we sell the asset, we have a bigger chance to profit out of it because the majority of the price action traders are selling. I’m talking about profits in selling because keep in mind the following:
With the Forex brokers, we have the chance to benefit when the price drops because there we trade with CFD trading which means Contract for Difference.
Or in other words, we can sell an asset without having it previously and we can close the position at a lower price and benefit out of that.
Now, with the exchanges, and especially with the cryptocurrencies, everybody is looking for the moment when to buy because when selling it at a more expensive price, we will benefit.
Let’s go a little bit earlier after the period of 2019. I’m not going to talk about the periods of 2017-2018. This was a crazy time for the Bitcoin. Everybody was buying. There were not really rules in there, it was just one direction and everything changed at the end of 2017 and the beginning of 2018.
The market gained stability
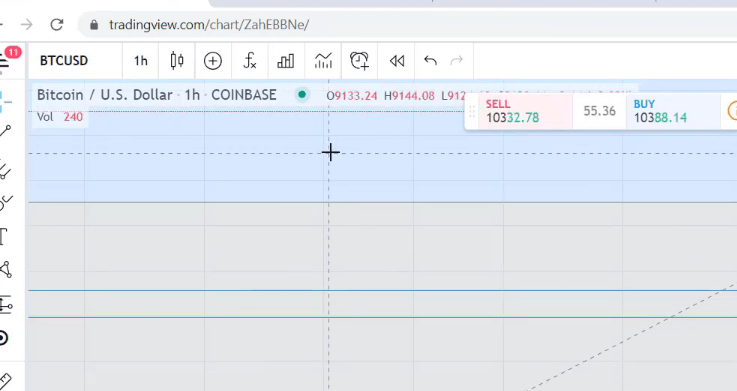
However, after 2019, we have a very normal market for the Bitcoin which allows us to apply different price action strategies and to benefit easily and without so much stress as it was in 2017 and 2018. To explain what this price action strategy is, I will start from the plain chart.
And after that, I will demonstrate to you some of my recent price action trade and I will show you some real statistics of my trading and you will see how I applied. As I have said, we are in an uptrend when we have a series of higher highs and higher lows.
It’s very obvious that we have a series of higher highs and higher lows. The price is going up. And what we are looking for is when to join the trend or in other words, when to get on the train.
What is price action trading?
We analyze the price to find the best possible entry, and we use price action trading strategies to know when exactly to buy and when exactly to sell and to get off the train. For this period, you can see below that the price is going aggressively upwards.
The mistake most beginner traders do
If you look at the market like that, it’s really risky to buy at such a moment because we never know when the move will stop.
And most of the time, this is a common mistake that the beginner price action traders do to buy at such highs and after that, the price just pulls back and they might turn into a huge loss.
For example, the price reached 8,250, and then it dropped nearly to 6,500. That’s a huge drop and most of the traders just get afraid and they want to sell. They sell because they don’t want to take bigger losses.
The smart price action traders are going to buy exactly on these pullbacks, also called retracement. This is very normal because, at this moment, the smart investors and smart traders are taking their profits. They sell and this makes the price drop.
However, the majority of the people still want to buy and they push the price higher. So how can you use these pullbacks? The price action strategy that I use relies on the counter trend line. What is the counter trend line?
The counter trend line is one of the best price action patterns
It’s a line that goes against the trend. As we said, at this period of time we are in an uptrend. So the counter trend line is a line that is against the trend. It’s not with the direction of the trend but it’s against it. It’s the opposite drawing that we do with the regular trend lines.
And when the price breaks this counter trend line, it’s one of the best entries I have ever used as a price action trader. I’ve been using now the counter trend line for over 10 years and it works great.
And it will continue working great for me and for many of the students that I have in the Academy because it represents the intention of the people to buy again after a normal retracement on the market. Because the price was going up, there was a retracement one time, a second time, and then a huge retracement.
And when the mass of people or the mass of the traders are ready to buy again, they buy and the price just goes up. These are the moves that we want to catch.
This is really easy to be used. No need to go for complicated price action patterns, butterflies, and all colorful charts that you see many traders doing just to make you confused and to sell you different systems and strategies that are so complicated.
Failure of the recent low is not an indicator. It is a sign of weakness.
They really cannot prove to you that they are profitable. However, in my courses, I show live examples and in the Price Action Trading Course, I show real trading from using the counter trend line.
And in my recent Cryptocurrency Investment Course, I showed every single trade that I’ve been taking during the past months and I will keep recording it.
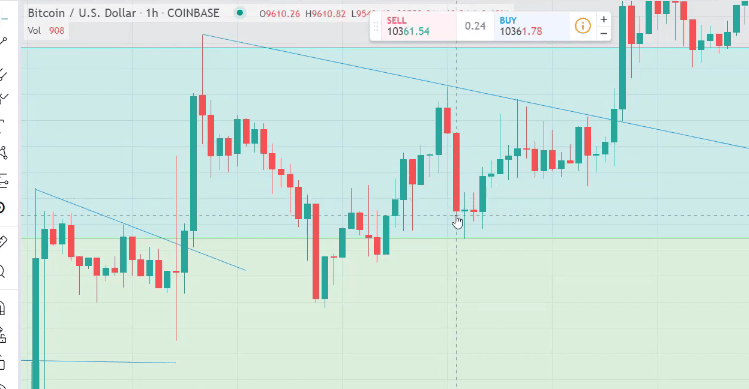
So if you want to see my live examples of how I’m trading with the counter trend line, you can have a look at these courses. But now I want to teach you how you can use it for your trading. To have a look at a more detailed chart, I will go to the hourly chart and I will explain to you how I draw it.
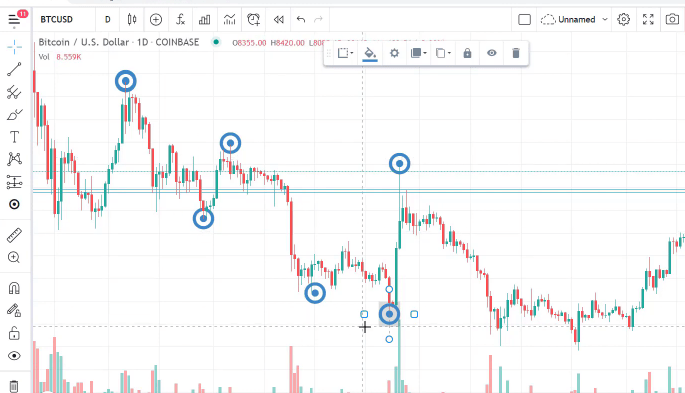
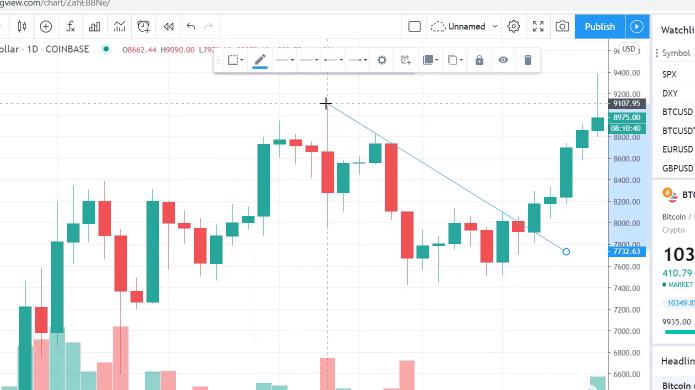
We have a series of higher highs and higher lows, and then we have one lower high which we call the failure of the recent low which means that at this moment, the buyers are trying to push the price higher but they fail and the price forms a lower high.
One high is lower than the other which allows me to draw the counter trend line.
This is exactly price action trading because I use the action in the price to do the drawings. And when the traders and the investors fail to take a certain high, the price forms a lower high, and the price drops, and I have the chance to draw a line.
You better stick to the simple price action trading strategies
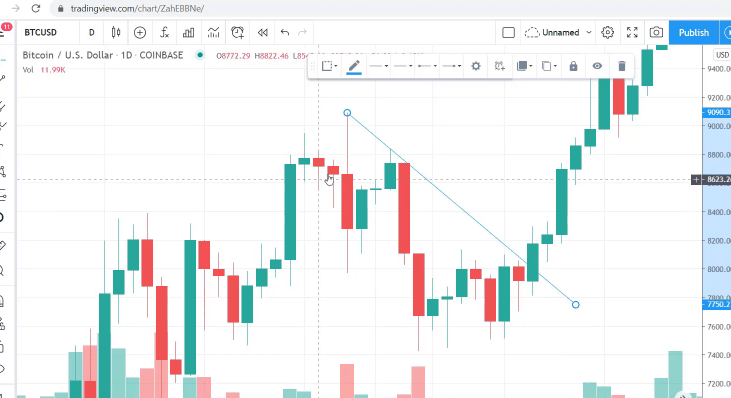
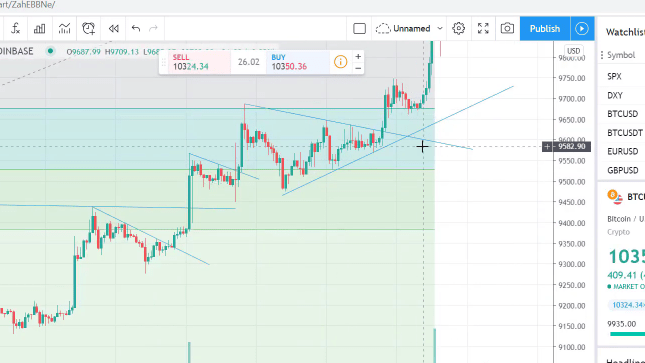
Very simply, to draw a line you need 2 points. In this case, it is 2 highs. After the retracement, when the mass of people is ready to buy again, the price pushes again. And the moment it breaks the counter trend line is the moment for the entry. This is where I take the trades.
And just a little bit earlier before this example, we had another opportunity, another counter trend line. Again, we have a new high and then the price fails to take it which means that the resistance of the people who are selling is stronger than the buyers and they don’t allow the price to cover that top.
The price drops and this gives me the opportunity to draw the counter trend line. Then a very impulsive break of the counter trend line which happened just in one day and in this case, the price of the Bitcoin moved from 8,073 up to 8,732.
So the counter trend line is a really great price action trading technique that you can apply for any asset. There are plenty of different price action trading strategies but if you really stick to the simple ones, like this price action strategy that I demonstrate at the moment, you will have a better overview of the market.
The Fibonacci is a price indicator
You will see actually where the price is. Because if you draw too many price action indicators over the chart, or even sometimes it can be one price action indicator, it makes the chart very hard to read. I’m not going into details now but I will draw any indicator catching some of the moves. You will see that they are very colorful.
And if you put too many lines, you will really mess up and you will not see the price.
And when we are doing price action trading, the price is what’s most important. So I keep it very simple. Now, if I go to some of my recent examples from this year, actually from yesterday, you will see how my chart looks.
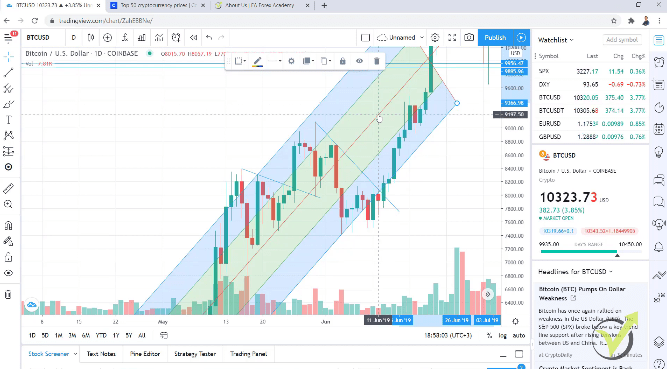
If I go to the hourly chart, you will see that I have colors just because I use the Fibonacci which is a great price action indicator and I use the Fibonacci to know where is my target.
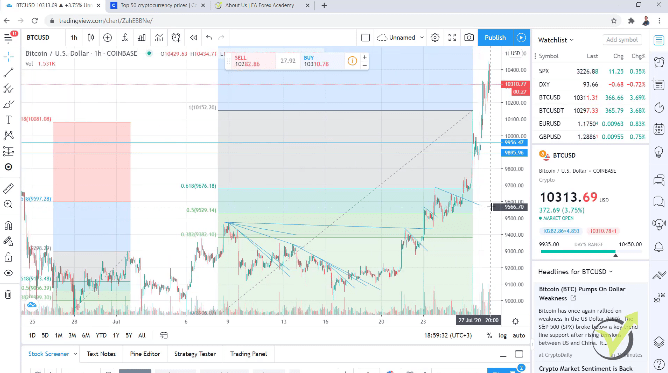
And yesterday my target from the previous Fibonacci that I had was just reached. The price reached above 10,081 and I had my target reached which made me sell some cryptocurrencies. I have sold Chainlink, Stellar, some Ethereum because the Ethereum did a great move together with the Bitcoin.
I will show you the results of this price action trading strategy.
And usually what I do is to analyze or I do price action trading over Bitcoin but I trade the smaller cryptocurrencies because, simply, they move faster in percentages. I explained that in detail in my Cryptocurrency Investment Strategy Course.
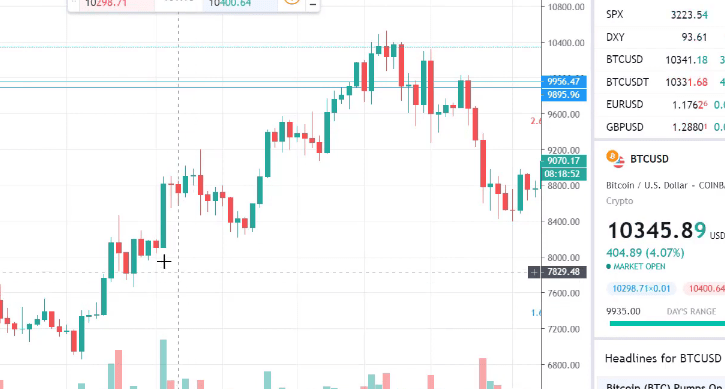
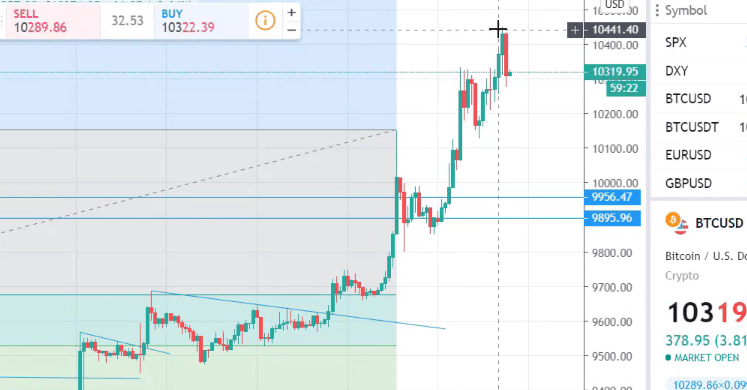
To give you an idea where my last entries were using the counter trend line, I bought the most recent one on the 25th of July, just a few days ago. The price failed to take the high and the price broke aggressively. So I bought cryptocurrency at that moment and it was a great entry.
It was below the $10,000 and when the $10,000 was broken, you can see below where the price reached today, above $10,441.
And because I know many of you are very skeptical and they want to see actual results, I will show you some results.
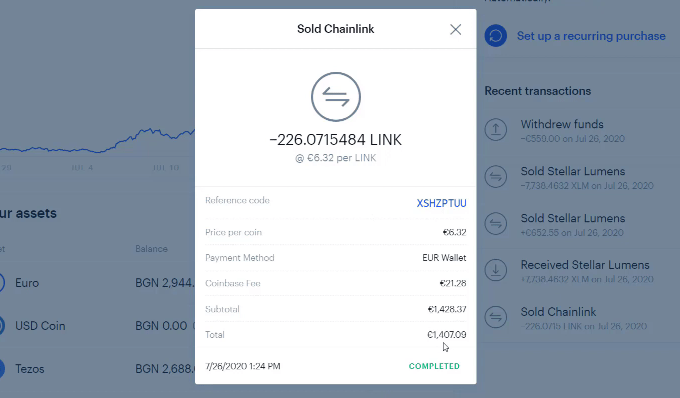
I will open my Coinbase account and you will see that yesterday, on the 26th of July, I sold Chainlink. In this case, it was about €1,407 and I sold 226 of a Chainlink which I bought at a really nice price. My total investment here was €1,000.
Withdraw your funds whenever you need
So from this single trade, I have €407 which is 40.7%.
And as well, yesterday I sold Stellar. I sold €652 and my initial investment was €500, so €152 was the pure profit that I did with the Stellar.
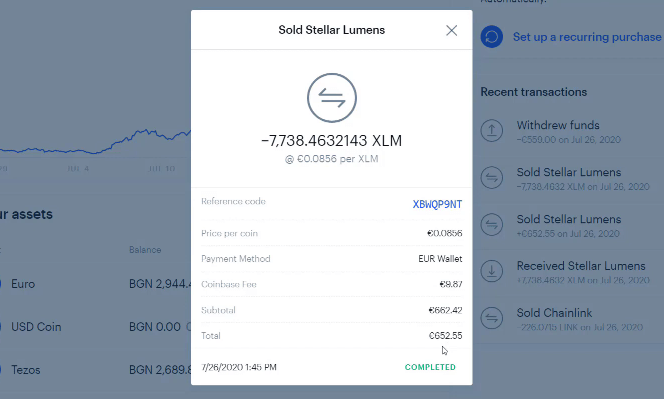
That’s my overall portfolio in one of the Coinbase accounts that I have.
It’s very stable going upwards and it’s in an uptrend which is very good for me.
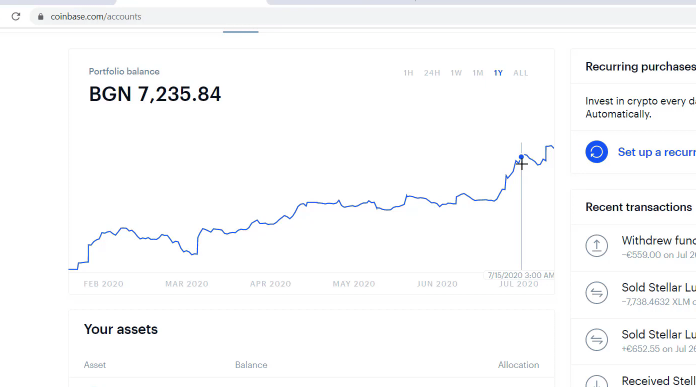
However, I achieve these stable results over time just by following a strict price action strategy and I have very strict money management which I explain again in the course.
And there’s a recent drop in the account because I simply recorded an example for the course and I wanted to show how to withdraw. So I did a withdrawal yesterday or this was just the profit from yesterday.
I did a withdrawal to my Visa card to show the beginner traders that with Coinbase, there are no issues to withdraw funds back to your Visa card or to your PayPal account. And by the way it happens instantly which is pretty cool. So whenever you need some money from your wallet you can withdraw it.
Do not involve emotions when trading
This is the price action trading strategy that I’ve used for so many years. Recently, I trade a lot of the cryptos because, as I said, since 2019 the market is just a normal market. The price goes up and down and it’s not as crazy as it was in 2017-2018. You can apply different price action trading strategies.
But keep in mind that whatever strategy you select to use, you need to be very strict and you should not fall under emotions because as you know, emotions are what make people lose. For example, yesterday I took some profits after the Bitcoin reached my target of 2.618 from Fibonacci and it continued higher.
If I allow myself to fall into emotions, I will say, “Alright, let me keep these cryptos longer.” And because the price is going upwards, I want more profit but I will show you what happened with these cryptos that I sold yesterday. I will click on Prices and you will see that Chainlink is down by 7.34% and the Stellar is down by 7.27%.
For some reason, since yesterday the Bitcoin is going upwards, but the Chainlink, Tezos, and Stellar are going downwards.
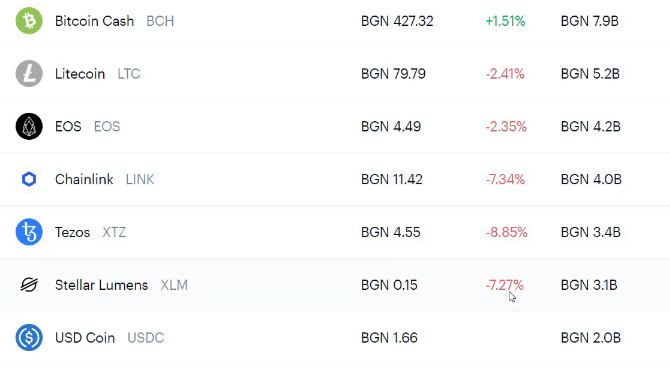
And if I had waited longer, I would have lost my profit. So I’m very strict. This was my target. I have recorded examples for the course.
The flag is one of the popular price action patterns
Exactly when the profit is reached, immediately I sell it and that’s it. I’m not greedy to keep it longer or to buy again right after I have sold. I wait for the next counter trend line which still didn’t show on the chart. And by the way, my last entry was a great price action pattern.
Actually it was a flag, I know that many of you are familiar with flags.
But I prefer just to draw the counter trend line, no need really to draw a flag. For the beginners, the flag is one of the price action patterns where we analyze if the price will go upwards or downwards after it breaks any of the lines of the flag.
So we have a move up, then we have a flag. If the price breaks upwards, it’s expected to continue higher. However, I would not rely on such price action patterns but I would rely on the trend. I would like to see the bigger picture and if we are in an uptrend, definitely I would like to buy.
And to see the bigger picture, you need to go on a daily chart to recognize that we are in an uptrend. So the very small flag that we have in the hourly chart is not really the thing that I am following. I want to know the big picture which is the trend and then I zoom it to the hourly chart to look for price action patterns.
Don’t hesitate to test this price action trading strategy
With this simple price action strategy that I demonstrated, I use just the counter-trend lines to enter the market. And, one more time, I show many examples in my trading courses and recently, especially in the Cryptocurrency Investment course and in the Price Action Trading Course.
Thank you very much for reading the lecture. If you have enjoyed it, I will really appreciate it if you share your experience in the comments below. If you have questions, let me know in the Forum.