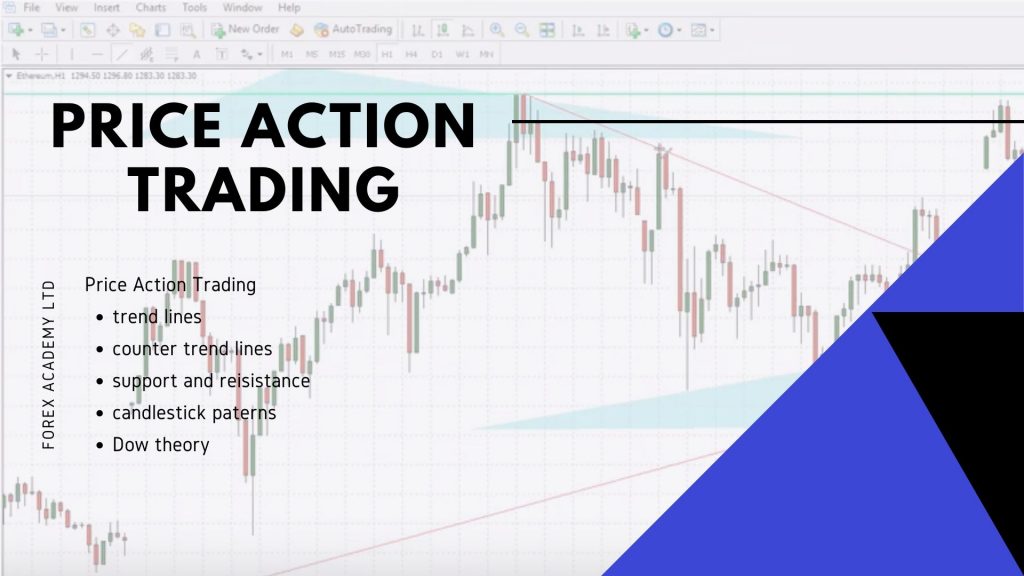
Price action trading is a simple method that represents market behavior
Price action trading, and the counter trend line is the topic of this lecture, which is a free lecture from the Basic cryptocurrency trading course. We have one whole course called The never losing formula – Bitcoin trading and it is based on the counter trend line which actually gives us fantastic entry point for the trades and I will show you an example here in this course as well.
I will continue now with the Ethereum
I draw lines and trend lines and I will leave the others for you as practical activities just to practice to draw the trend lines, the counter trend lines over the chart which are actual price action trading.
So, what is the counter trend line?
From the name obviously you understand that this is a line that is opposite the trend. And the trend line is the line which gives us the sign that the price continues the trend.

Now if I take this most recent high actually this is the record high that we have on the Ethereum, I will draw the counter trend line on the opposite direction and you can see for example if I connect it with this high over here, here I have a great entry, guys. You see very impulsive break. What we were saying that impulsive break when we have a long candle closes on the high and the bigger part of the candle is above the line. So, it’s the same rule when we do counter trend line. When we do price action trading we follow simply the traders behavior.
If I come back here you see I have my counter trend line and if I just move it slowly you will see that what happened is the price broke it, retested it very same thing what I said with the support and resistance when any line is important to the market it’s very possible that the price will retest it and it will continue higher. Now if I go back you will see that this counter trend line could be actually on many places, right?

It could be here connecting some of this high or I can put it here and draw it here you will see it will give me another great entry.
So, what’s the idea here?
We are in an uptrend, the price reverses. But we don’t know how far it will go down, we can use the support, we can use the trend line, but the important is that we want to enter with the trend just when the price starts to go up again. It is starts to follow the trend again.

I will have this great entry at this level over here and as you can see you would have great profits if you have entered there. Now I can draw it here, you can draw it on so many places. Obviously here another great entry and then you can go back and back and you can go much lower. In the price action trading you will see that there are some great, great opportunities using the counter trend line, that’s why I will leave it to you with other cryptos, just to draw it by yourself, to see it by yourself.
When we have a recent high, guys, just connect it with the other ones and you need minimum two and this example here is great, because you can see that here I have one touch, two touch and three touches nearly here which makes the counter trend line very sustainable, very strong and it makes the counter trend line important to the market, and a great tool when we do price action trading. And as you can see here if you enter here your Stop Loss would be great to keep it just below the trend line.
I really don’t want to give examples over history data
Many instructors are doing that, they will give you so many examples it’s great to enter here, it’s great to do this, it’s great to do this. Obviously it’s very easy when you know what happened. So, I will go back to the recent moves, the ones that we have from today, from the last days and as we said the recent counter trend line was this one over here.

Which gave this great opportunity to enter. I actually record it with the other Ethereum trading course that I launched recently, here an example where the price broke exactly this level, but it was because of the trend on the lower time frame. It’s totally different system, I don’t want to make it confusing here for you, guys. So, let’s focus on this counter trend line.
What we have when we have counter trend line, is that we have aggressive counter trend line
This is again price action trading tool. This means that this is a great opportunity to enter at this price when the price breaks the counter trend line, but we can draw more aggressive counter trend line which will be from this top connecting this top over here. Now you can see that if I entered here I would enter in a long position in a buy position on much cheaper price.

Instead of entering at around 1240 I would be entering at 1184. As I said, I don’t want to give examples over the chart, so let’s go to the most recent movement that we have from today. I will just zoom it a little bit even more and you see these are the last hours from today and let me just take the line and you see from here I can draw this counter trend line. Now if the price breaks above I can enter or if the price just forms another lower high I can draw more aggressive counter trend line and enter into the trade. Now this is the example strategy, guys, that I want to show you for manual trading.
For this strategy we will need actually three things:
- we follow the trend on the daily chart, let me just show you where is it. We follow the trend on daily chart, we have series of higher highs and higher lows
- when I go to H1 chart, we are having the counter trend line, as you can have different price action trading tools used
- we are looking for the more aggressive counter trend line to enter into the trade with the direction of the trend.
Now obviously, if I just zoom out a little bit you can see that this is already aggressive counter trend line, because the counter trend line would be this one over here connecting this record high that we have and the most recent one. But this is nearly, nearly a support and resistance. You can see it’s very close to a horizontal line, anyway it’s not a horizontal line, so we can consider that this line is a counter trend line, as well and here we have this aggressive counter trend line. So, if the price now goes lower and forms another lower high I will have another more aggressive counter trend line and I will be able to show you an example with this aggressive counter trend line and I will do this in the next lecture.
If you are looking for more price action trading, you can have a look at the Professional Forex trading with full analysis course.
Please, write to our support FORUM for any questions.