
Meta Trader Forex Platform
Meta Trader Forex platform is most common for Algorithmic trading and it is nothing complicated. Many traders avoid it because they think it is rocket science.
But it is quite simple to create algorithmic trading strategies and to automate them as Expert Advisors even if you don’t have any programming or trading experience. I will show you the process I follow.
This is a free lecture from my courses and to make it even more comfortable, I include Expert Advisors in my courses if you want to use them for your trading and if you don’t want to go through the complete process.
I will show you the Meta Trader Forex platform, which is the most reliable platform for Expert Advisors, and the best thing is that it is free.
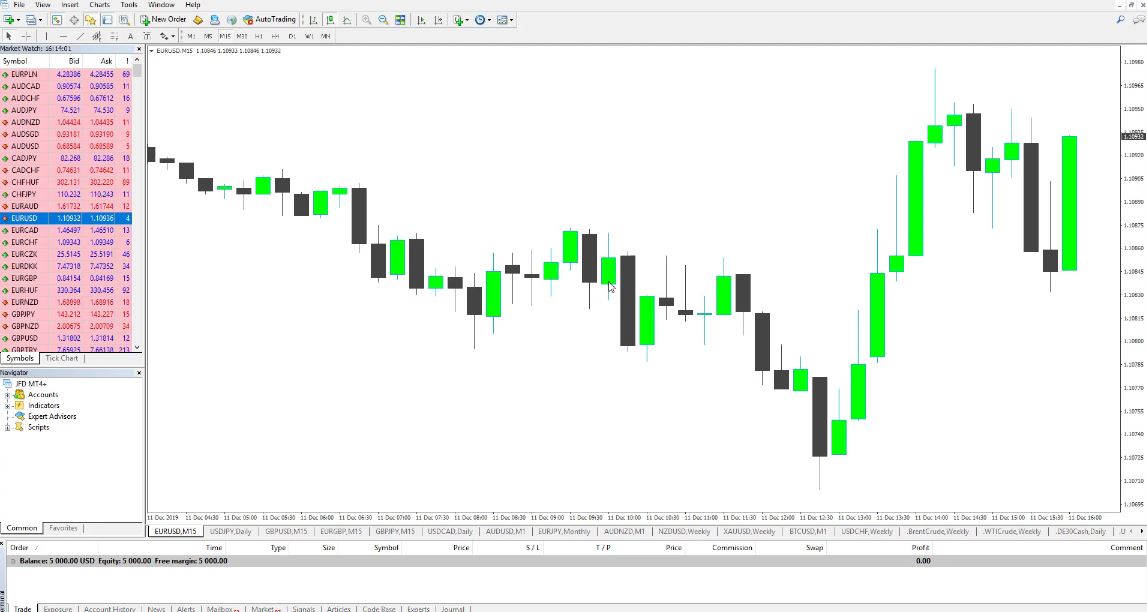
Most of the regulated brokers provide it, which makes it very popular. Below is the Meta Trader platform; this is how it looks.
When you install it for the first time from your broker, it will probably look different. But you can change it. You can modify the colors on the charts.
You can change the windows as well, you can change the size, for example, of the terminal, or for the Market Watch, and many different things which I will mention in the course.
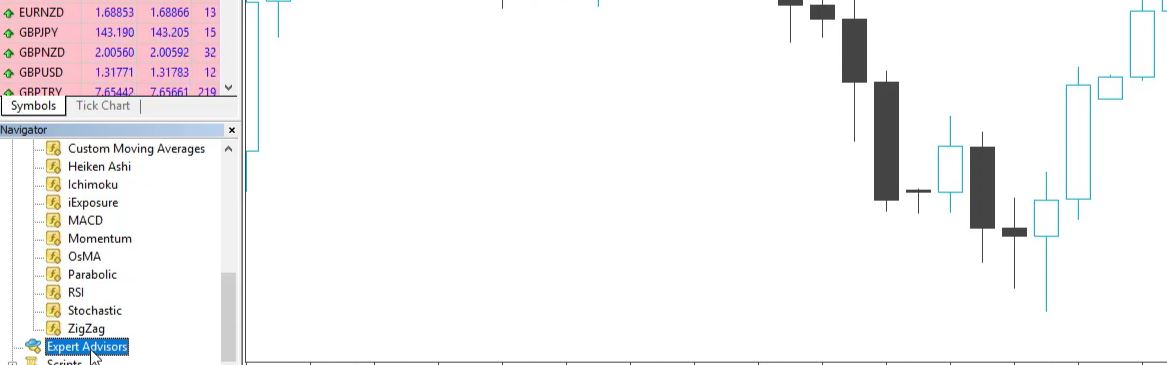
The Market Watch
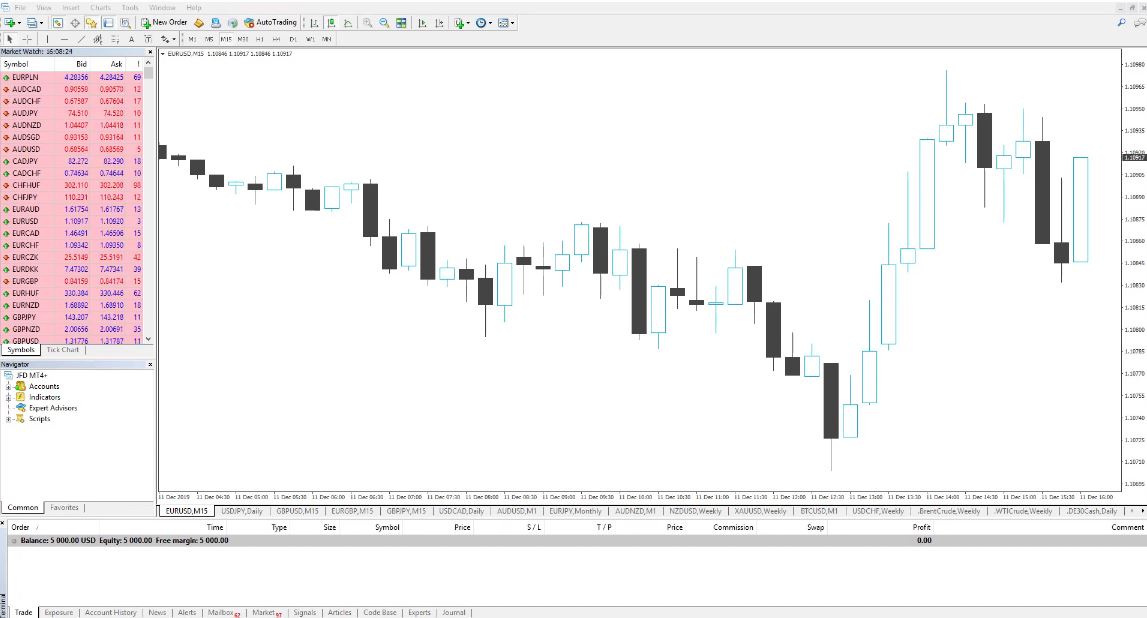
Let’s start with some basics. In the middle, we have a chart. This is where we see the price, at the current moment I am on EURUSD. And when you install the Meta Trader for the first time, you usually will see just four currency pairs opened.
But with time, I have opened many more. And on the left side, we have the Market Watch where we see all the currency pairs.
Below the Market Watch, we have the navigator where we place the indicators and the Expert Advisors. And on the bottom, we have the terminal where we will see the executed trades.
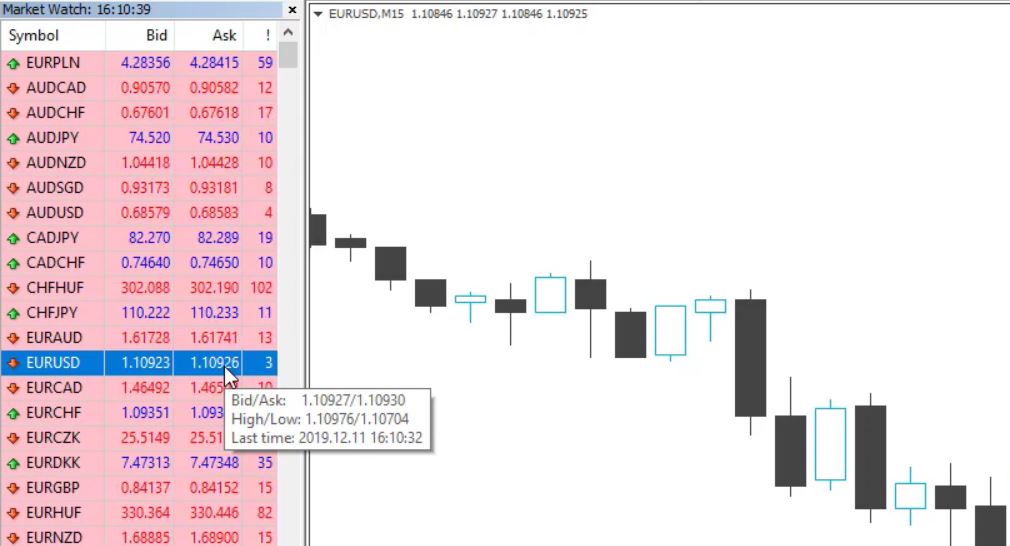
I will go through all of these very quickly, and I will give you the information that you need to know to trade with Expert Advisors. So in the middle, as I said, is the price. At the current moment, EURUSD is at 1.10917. The 5th digit is the point.
So 91 are the pips and 7, 8, the last digit, this is the point. Most of the brokers nowadays have 5 digits after the decimal comma in the Meta Trader Forex platform.
So you see below it’s 1.1092, 1.10926 and at the end, it is 3, so we have 2 different prices. One is the bid, and the other one is the ask, but I will come back to this a little bit later.
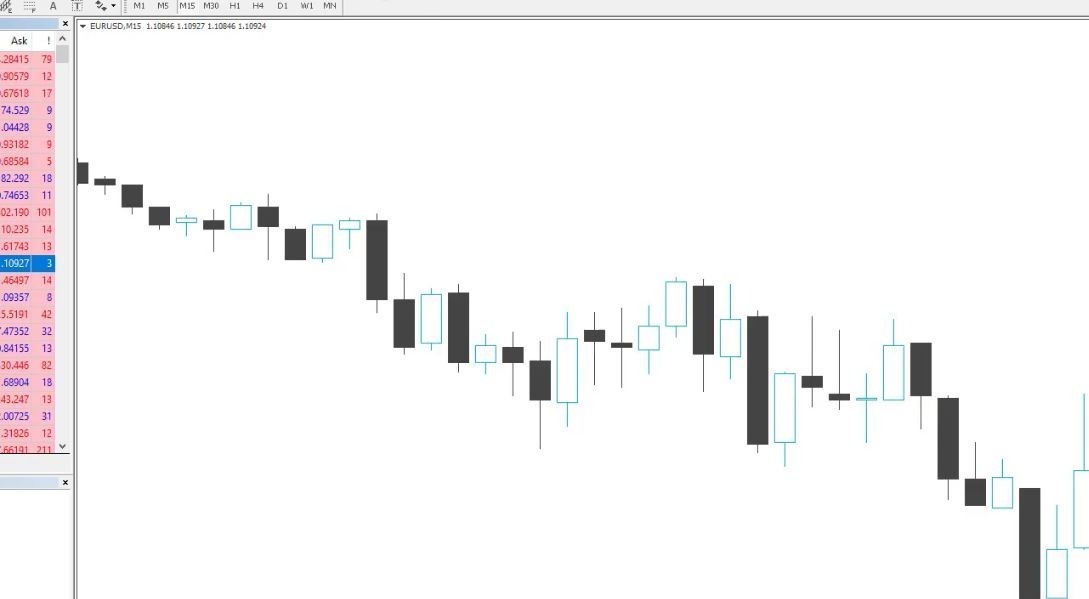
This is the current price at the moment, and we see all of these so-called candlesticks. This is the first type of chart. We have 3 different chart types on Meta Trader.
The types of charts on Meta Trader Forex platform
BAR CHART
CANDLESTICKS
LINE CHART
The candlestick chart is the most popular in Meta Trader for Forex trading, and most of the traders use it because it brings us a lot of information. If I am on M15, this means that one candle is 15 minutes.
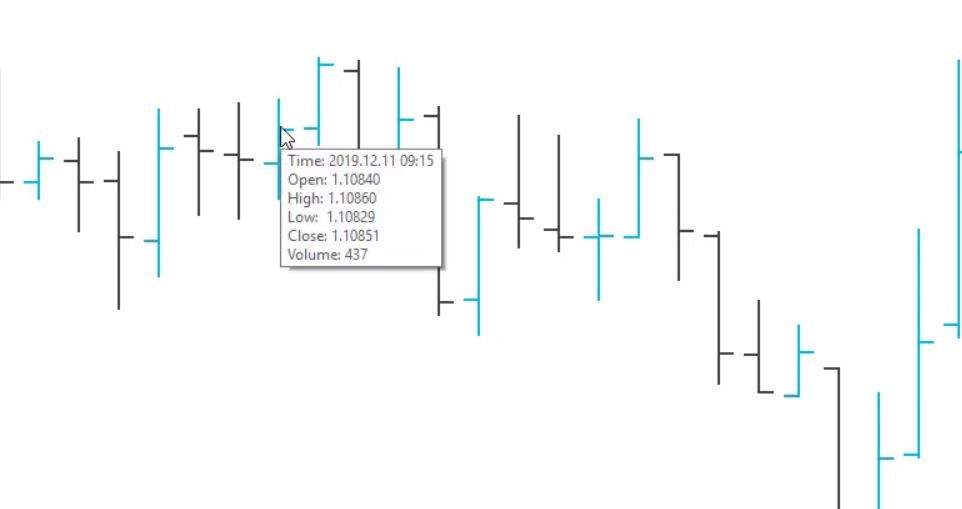
The candlesticks were called historical data in the past. And the data they bring to us is formed by 4 values. One is the opening, which is where this candle opened, the open price.
Then we have the closing. This is where it closed. And we have a high point and the low point. In this case, if the candlestick is black, we have a negative one. If it is white, we have a positive one.
In the negative candlestick, the open price is higher than the close price. And if I put my mouse on the closing of the candlestick, you will see that I have the open price, I have high, I have low, and I have close.
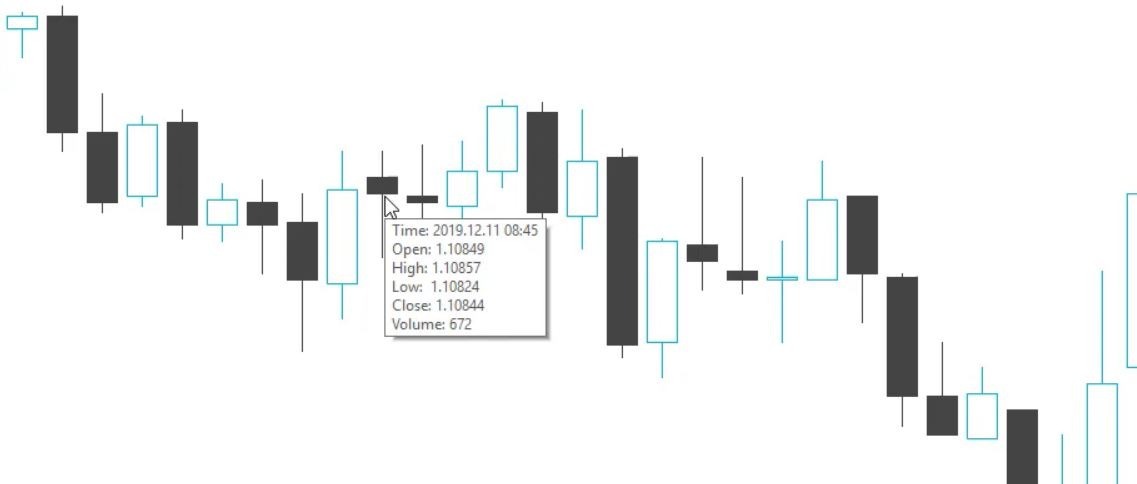
These are the 4 values. After the close you see, the next candle opens, the price goes up and down, we see the highest point, the lowest point, and it closes. And when it closes, the new candlestick will open.
Changing the colors in Meta Trader Forex charts
This is how the candlesticks are formed. It’s very visual which one is positive and which one is negative.
Now, if you want to change the colors, you can right-click over the chart and go to properties. From there, you can change the positive bars and the negative bars.
The Bull candle is the positive bar, and the Bear candle is the negative bar. This is how they’re called.
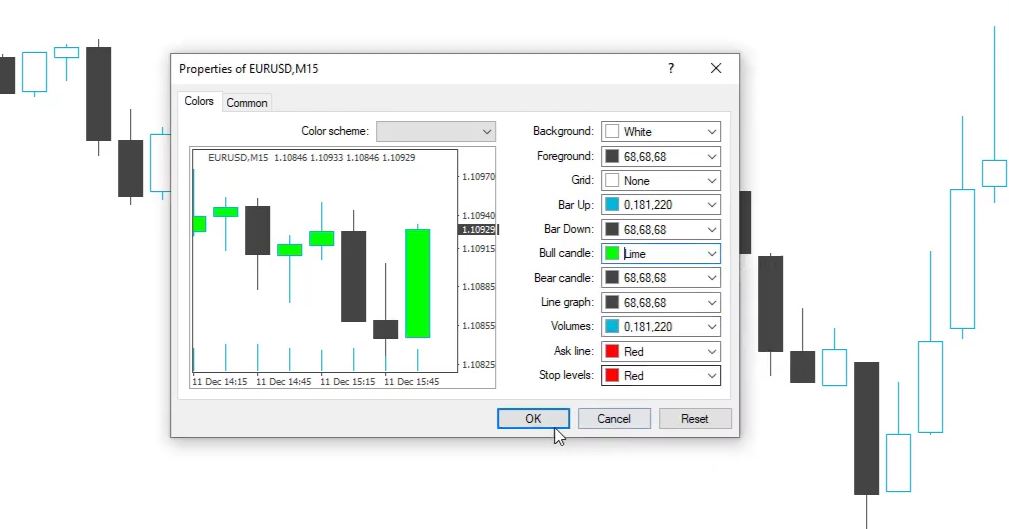
So if I just change it, for example, to green and I click on OK, you see all of the white candlesticks became green.
So you can change it to anything you want. I like the white screen. This is because it’s bright, it’s clear, and it’s easy to see. Even if I put some indicators over it, it’s very visual. But it’s up to you.
Now, for Expert Advisors, it doesn’t matter if you will be using white, black, green, red, blue, it doesn’t matter. You don’t need to put any indicators over the chart when you’re trading with Expert Advisors.
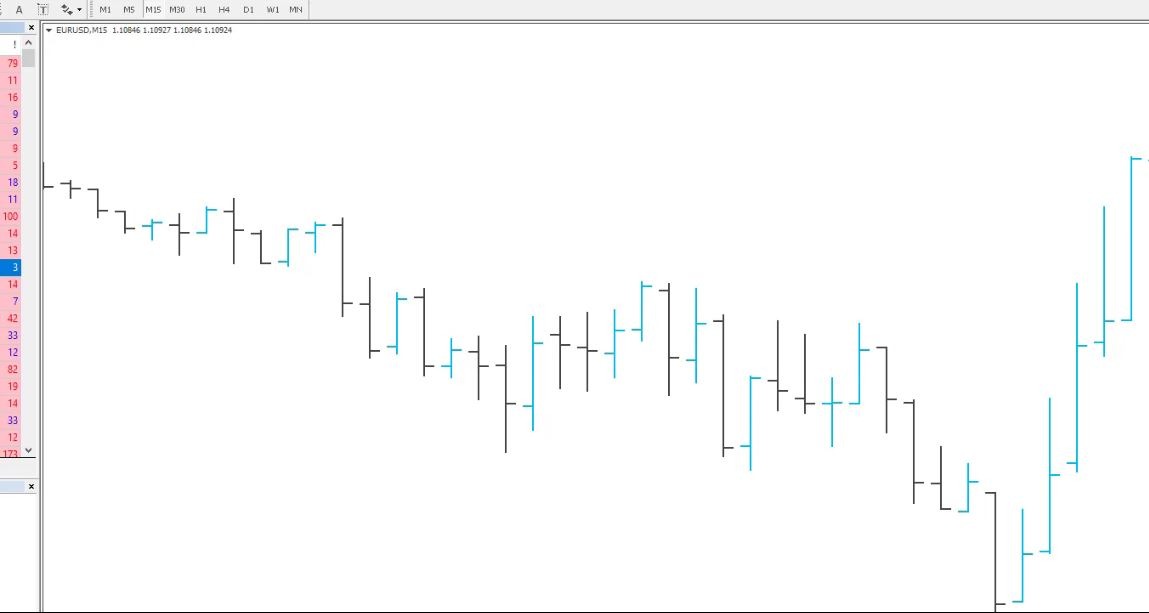
Now, the second type of chart is the bar chart. The difference is that the body is not fully filled. The body is the fully filled part of the candlestick between the opening and the closing.
The type of chart you use doesn’t affect anything.
We have small horizontal lines on the left side and the right side on a bar chart. So on the left side is the opening, and on the right side is the closing.
It looks different, but at the same time, it is the very same information that we have. Still, we see the open, the high, the low, and the close—the four values.
And once again, it doesn’t matter with Expert Advisors which type of chart you will use on the Meta Trader Forex.
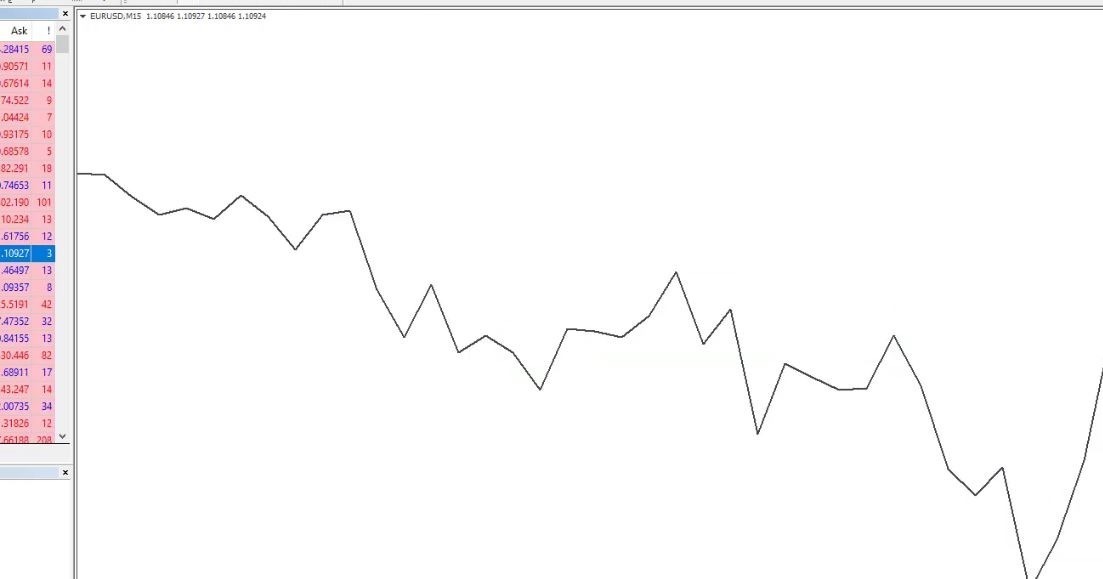
The third one is the line chart, where we see much less information. We don’t know the opening, the closing of the bar, the high or the low. We see a line that connects the closing of each bar.
If you stay on the line chart, you cannot see a lot for each candlestick or for each bar. You just see a line. You know the direction, and that’s the only thing you see.
The timeframes
Again, if you trade with Expert Advisors, it is alright to stay on the line chart, it doesn’t matter. But if you are using some manual trading strategy or anything that requires candlestick formations or patterns, you better stick to the candlesticks. So above the chart, we have different timeframes.
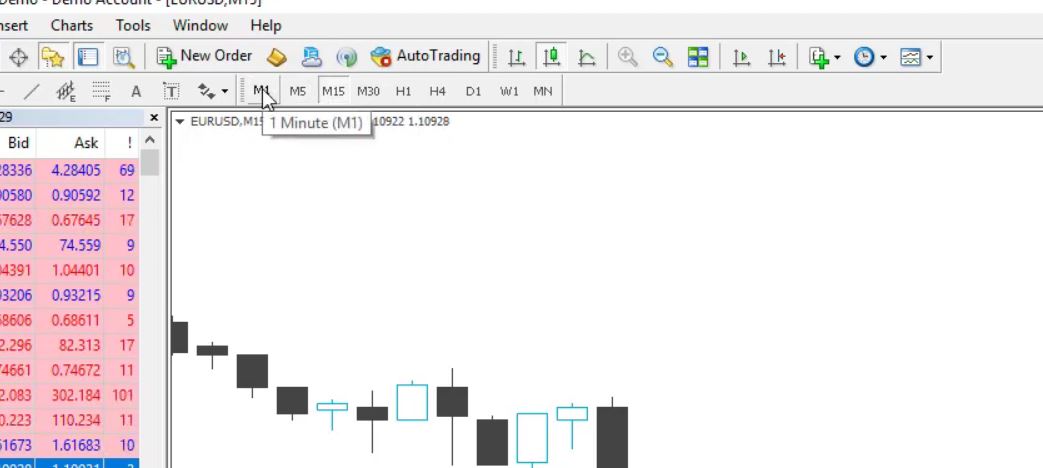
We start from M1. This is the lowest timeframe available, which means that one candlestick is 1 minute. So a new candlestick opens every new minute. Then we have the M5 where 1 candlestick is 5 minutes.
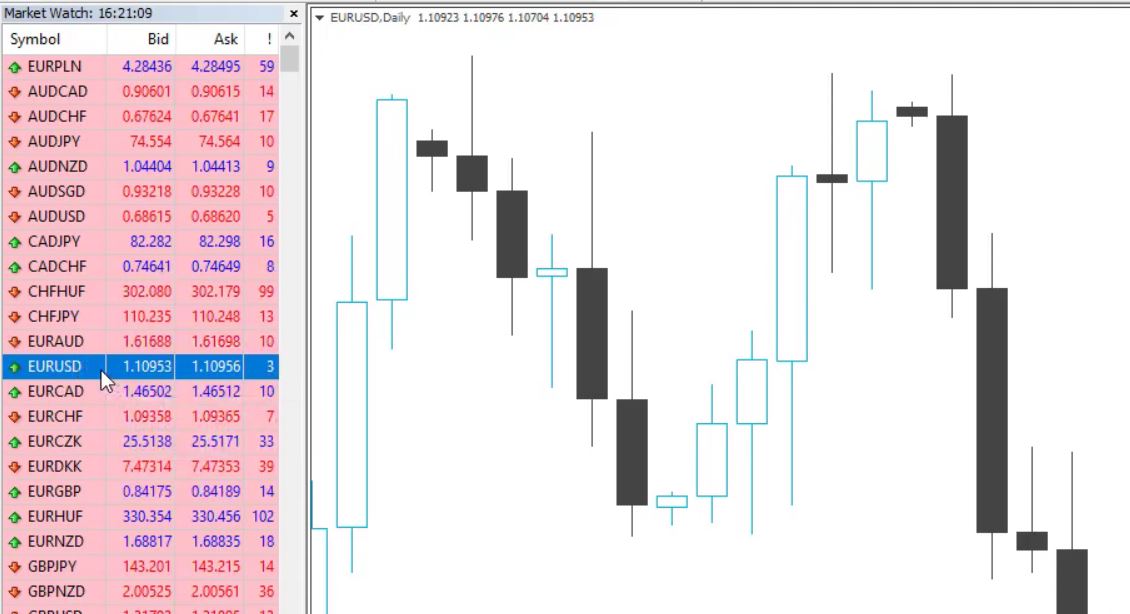
Then we have M15, M30, H1, H4, a daily chart, which is very popular as well because we see which days were positive and which days were negative. So, for example, right now, we see that yesterday was a positive day for EURUSD.
So the open was 1.1064, and the close was 1.1092, and it formed a positive day. The current day till the moment, even if I am late in the afternoon, you see that the open of the price is 1.1092, and the close price is at 1.1093. But actually, the close price at the moment matches with the current price.
The assets in Meta Trader Forex Platform
When the day closes and the new day opens, we will see what will be the closing price. So these are like the most important things over the chart, and these 4 values form the historical data which we use in algorithmic trading.
And in most of my courses, I show you how to export historical data and how to use it. And I will provide you with a script that you can use to export the historical data.
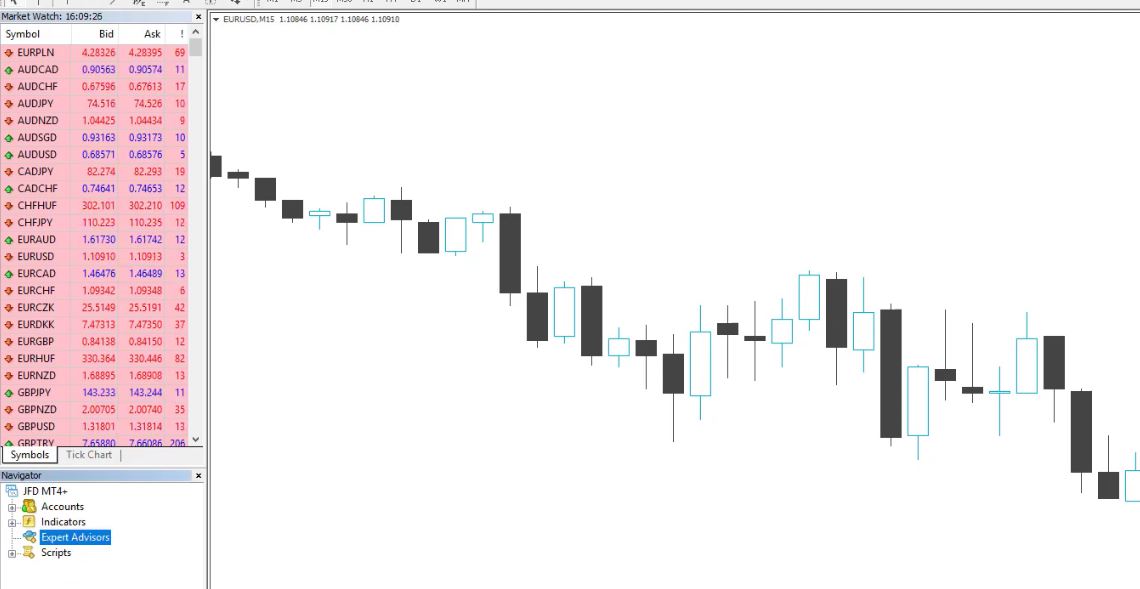
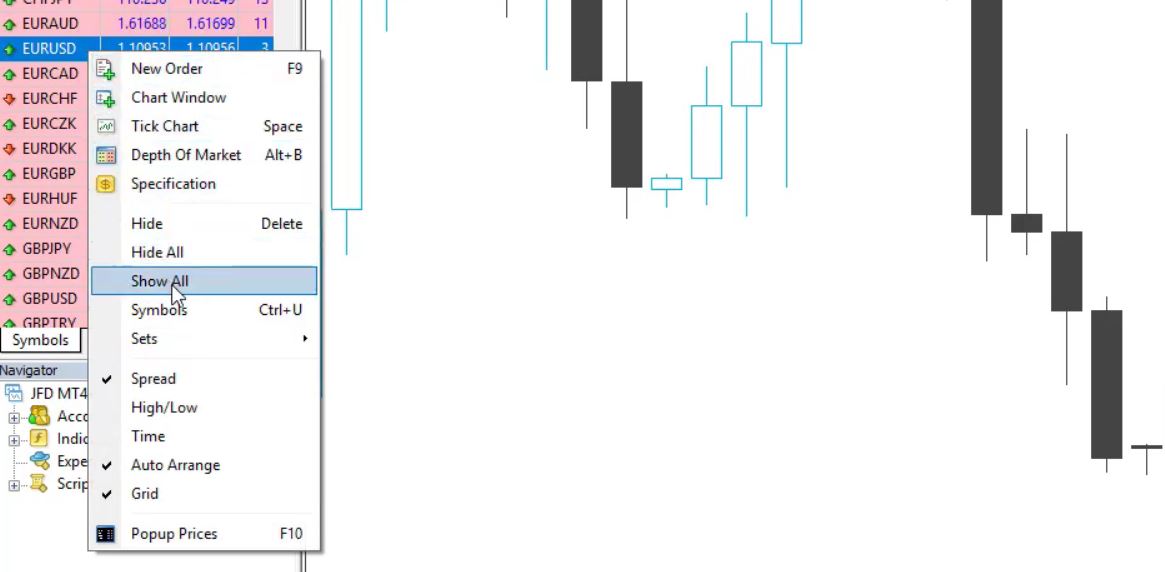
On the left side, we have the Market Watch, where we see all the currency pairs and assets provided by the broker.
If you install Meta Trader for the first time, make sure to right-click over any of the currency pairs and select Show All, and all the assets that are provided by your broker will appear right over here.
We have currencies. We have stocks, commodities, cryptocurrencies, and many other types of assets in Meta Trader Forex. We have 2 prices.
One is the bid price. The other one is the ask price. One important thing to remember is that we buy at the ask price, and we sell at the bid price. So if I open a long trade, if I buy the asset, if I buy EURUSD, I will pay the asking price, and if I want to close this trade on a later stage, I will close it on the bid price.
The Spread in Meta Trader
I will be buying at a higher price, and I will be selling at a lower price. And the difference between these 2 is called Spread. This is what the broker benefits.
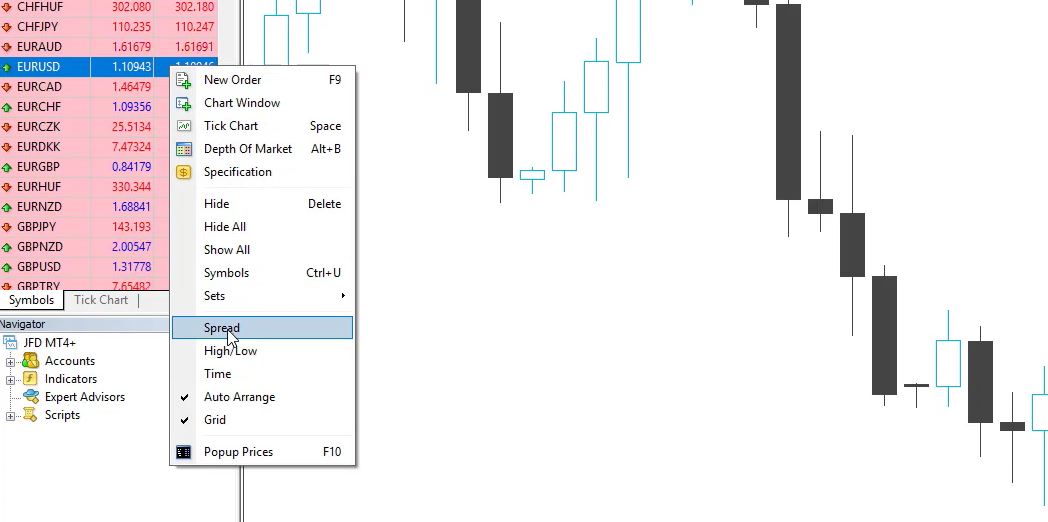
And on the Forex market, the Spread is very small. So the difference between the bid and the asking price is very small, nothing compared to what you see in the bank or on the exchange bureau.
In this case, I have just 3, 4 points of Spread. This is the 5th digit of the asset. And if you want to see the last column, just right-click again and check Spread. If I uncheck it, it disappears. If I want to see it again, right mouse and I click on Spread, and it appears.
Now, below the Market Watch, we have the navigator where we have Accounts. We can have 2, 3 accounts over here.
Do not switch between accounts in Meta Trader Forex trading
But when you’re trading with Expert Advisors, make sure not to switch between one to the other account. This is because if I have Expert Advisors in this account and I switch to another one, I will disable these Experts, and they will not work.
So many beginner traders make the mistake to have a Demo and a live account in Meta Trader Forex trading, and they switch between these 2 thinking that the Experts keep working on the Demo and on the live account. But that’s not the case. If you switch from one to the other account, the Expert Advisors in the first one will be disabled.
You need to be connected to the server of the broker if you want your Expert Advisors to work. And below that, we have the indicators which you can add to the chart, for example, the Alligator indicator. And if you want to remove an indicator, right-click, go to indicator’s list,
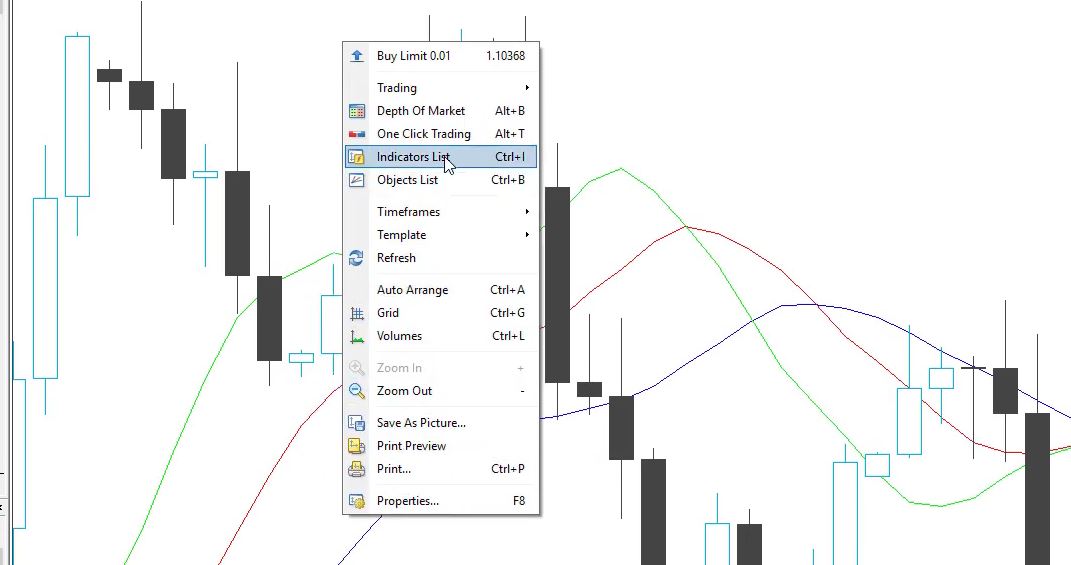
select the indicator, and delete it.
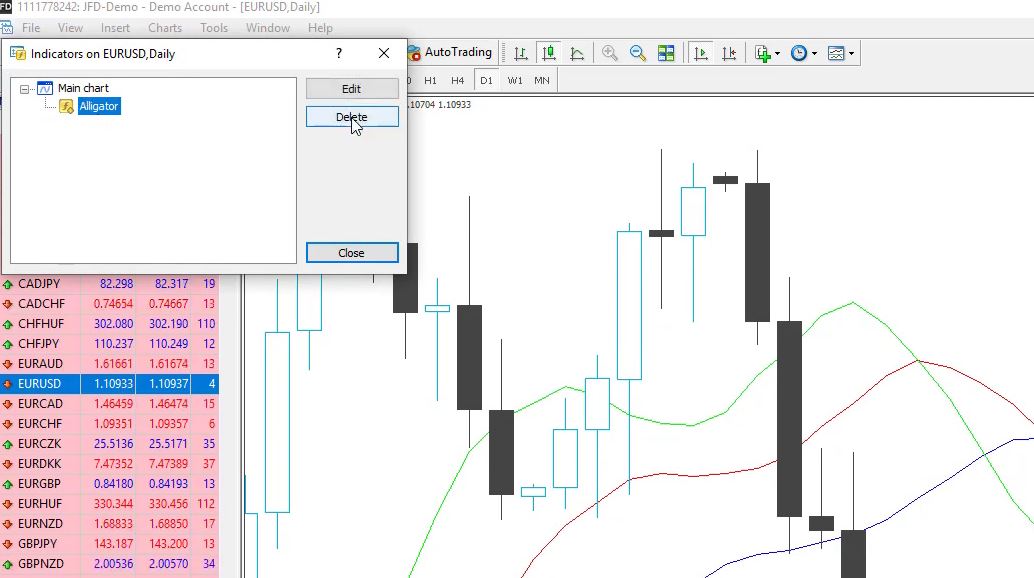
This is how you can delete an indicator, as well you can insert indicators from the top menu.
The terminal in Meta Trader Forex platform
But I’m not going through all of these indicators because we don’t need them, one more time, over the chart when we are trading with Expert Advisors and Robots. It is not a subject of this article, and this is why I will not go over it. Below are the Expert Advisors.
This is where we will place Expert Advisors. And in the next lecture, I will show you an Expert Advisor and how it works, and I will explain it in more detail. As well, we have scripts that are useful tools that we use.
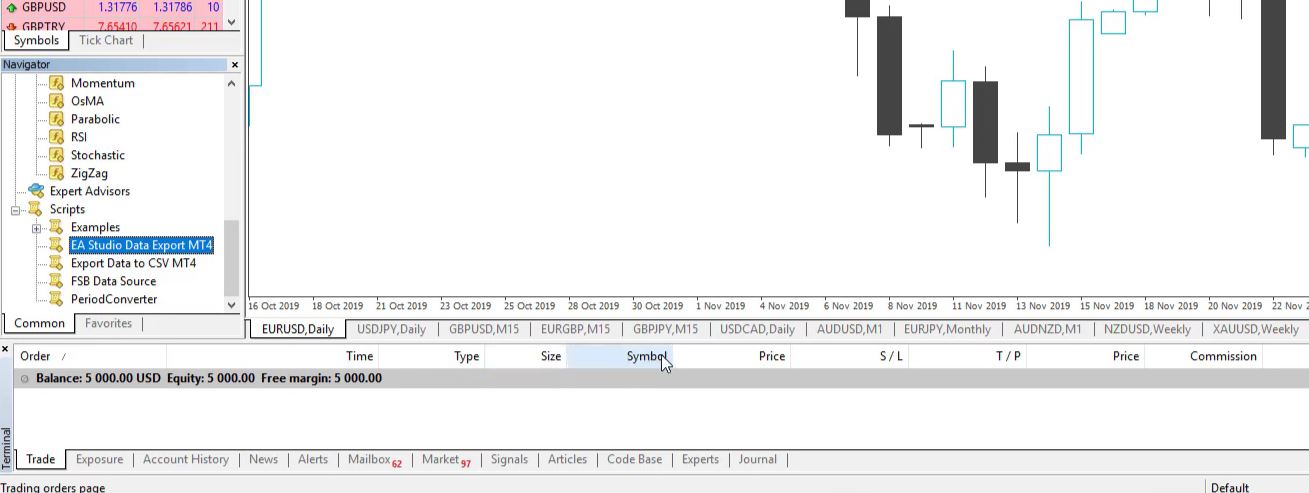
I will provide you with one which will help you to export the historical data of your broker. And below is the terminal. This is where we will see the open trades, the time of the opening, the size, the symbol, the price, Stop Loss, and Take Profit.
All of these things I explain in my courses, and I show examples of trading with the Expert Advisors using the EA Studio.
Cheers.