The greatest way to test the robustness of your strategies is by using the Monte Carlo tool in Expert Advisor Studio. Its main advantage is that checks if a strategy is over-optimized.
For this purpose, it tweaks certain parts of the history data, or the execution of the trades, and it also changes some of the indicators’ values.
After you alternate your strategy and the data a bit, and you notice that the backtest still shows good results, then it is very likely to profitable be with it when you trade it live.
On the other hand, if the strategy fails after your changes, then you shouldn’t use it in a live trading environment since it’s over-optimized. In other words, it works well only in specific conditions, and when they change it crashes.
The Monte Carlo tool runs 20 different random tests on your strategy by default. Also, you can choose to use one or multiple simulations.
Simulations for Monte Carlo
When you go to the Settings tab, you can fill the parameters that you want to use for the simulations.
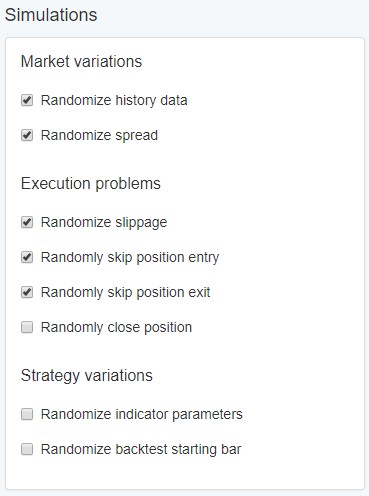
Market variations
- Randomize history data – Monte Carlo changes the range on a specific number of bars. Moreover, it is capable to alter their low and high values both for long and short positions. Quite amazing, isn’t it?
- Randomize spread – you can choose what value the spread should have. The range is defined in the Settings tab.
Execution problems – such problems can occur when the Expert Advisor sends trading signals to your broker.
Randomize slippage – the slippage is a common thing and it represents a rapid change in price. Sometimes it is just with one or two ticks before your broker fills your order and it gets executed.
The Monte Carlo tool adds slippage in the opposite direction of your order. If you go to the Settings tab, you can choose the value of the slippage and its frequency.
Randomly skip position entry – the tool skips some of the positions of your strategy in order to simulate the conditions during a live trading environment.
When you trade live, it happens to experience problems with your Internet connection, or with a computer that runs slowly. Also, your broker might have some technical issues.
Randomly skip position exit – in this case, the tool skips closing part of the positions. This can surely cause losses. It is preferable to enable this option in order to get more realistic results.
Randomly close position – this is not something that happens frequently. We advise you to stay away from brokers that close your trades for whatever reasons.
Strategy variations
Randomize indicator parameters – by default this option is set to OFF. When you activate it, the tool changes a certain percentage of the values of the strategy’s indicators.
Of course, this is just for the duration of the test. After all, if you see that the profits decrease drastically or the strategy ends up losing, then you know that it is over-optimized.
Randomize backtest starting bar – this is a good way to test your strategy as well. The worst thing it could show is that you can blow a whole account if you start the backtest from a different date.
Simulations chart – Monte Carlo
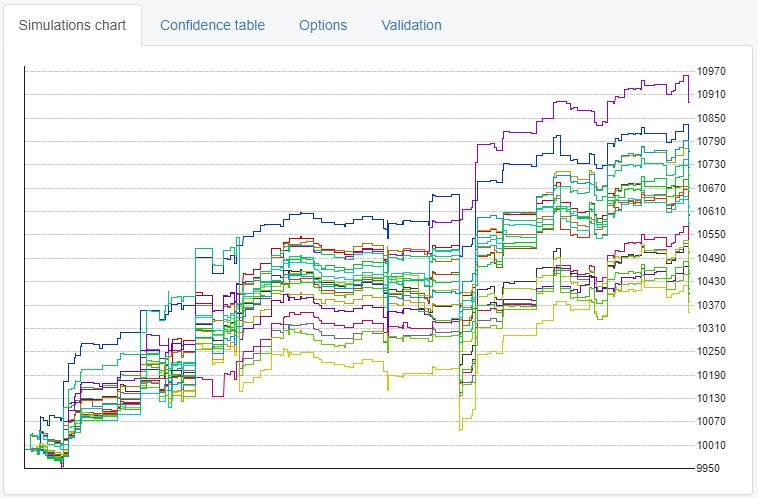
The Monte Carlo tool performs 20 random tests on your strategy. It uses the information that is set in advance in the Settings tab and the Simulations checklist.
When you look at the Simulations chart, there are lines with different colors that correspond to each test. Thus, you can easily see the backtest results, and whether the randomized data affected the strategy in a positive or a negative way.
Confidence table
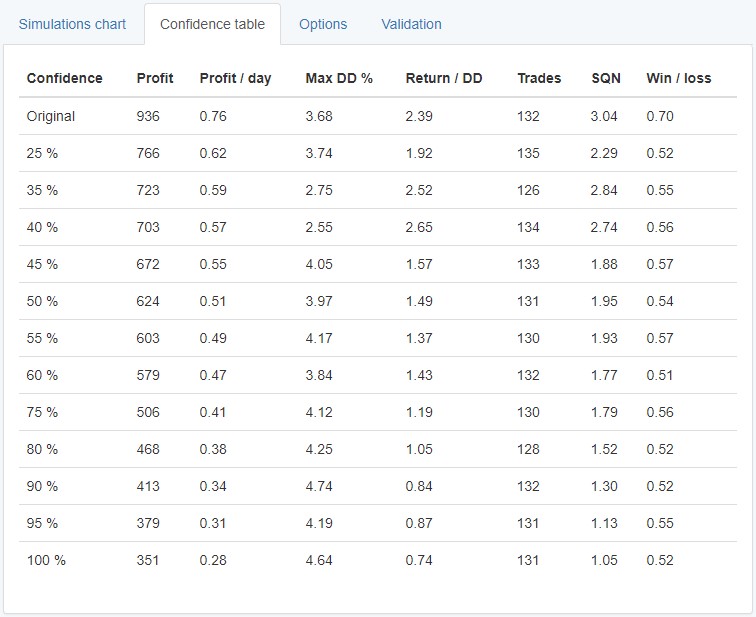
Here you can see the Confidence table. It provides you with statistics for all of the tests. The information about the original strategy is in the first row. Then, in the first column of the table, you can see the percentage of tests with a higher score than the current row.
Next is the “Confidence” column. It shows you the chance of having bigger profits in comparison with the “Net Balance” value.
As you see, there is 100% confidence which suggests that the strategy can provide a profit of 351 for the backtest period.
You need to remember that the results are based on past data and the tests are random. There is no guarantee that you will get the same result if the time period and the market environment are different.
The reason why the tool is called “Confidence Table” is that it exists in other trading software with the same name. It’s purpose is to show you the results from the random tests so that you evaluate their degree of success.
It can certainly show you if your strategy is over-optimized for the current market.
Settings
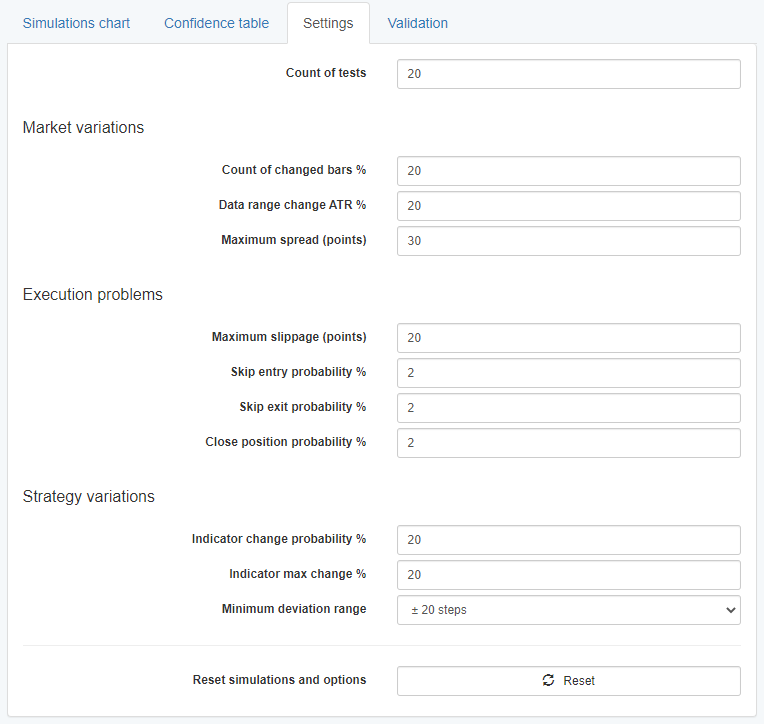
Count of tests – here you can fill in the number of tests that the tool is going to run. The default value is 20.
The following options will take part of the tests as soon as you activate them in the Simulations checklist.
Market variations
- Count of changed bars % – this is the percentage of bars that you change.
- Data range change ATR % – what percentage of bars will change based on the Average True Range indicator.
- Maximum spread (points) – the maximum value of the random spread that the tool uses.
Execution problems
- Maximum slippage (points) – here you put the maximum value of the slippage.
- Skip entry probability % – this option shows that there is a chance for each entry not to occur, and the default value is 2%.
- Skip exit probability % – respectively, the EA Studio offers the same option for the exits as well. The default probability for a trade not to have an exit is again 2%.
- Close position probability % – here the tool goes through each bar to check the likelihood for a trade not to close.
Strategy variations
- Indicator change probability % – it shows you how many of the indicators’ values can change. The default value here is 20%.
- Indicator max change % – this option shows the possible difference between the original value and the changed value.
- Minimum deviation range – this feature is suitable for indicators with low values because small changes in them won’t have much of an effect. Also, the default value here is 20 steps.
- Reset button – if you use this button, all the settings in the Simulations list and the Settings tab switch back to their default values.
Validation
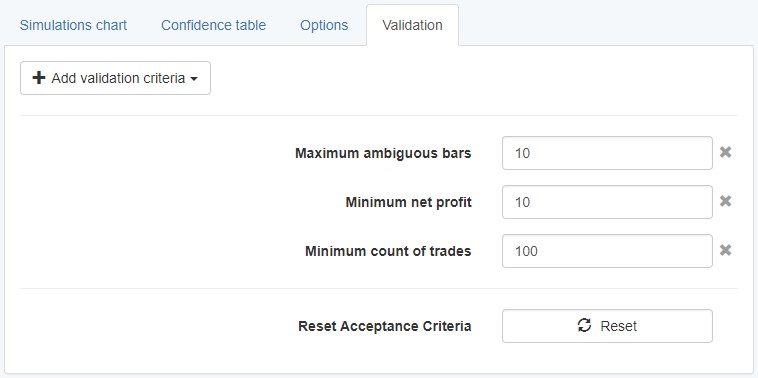
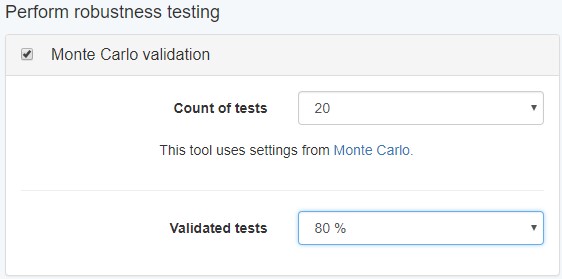
When you operate either with the Reactor or the Validator, you can see that the Monte Carlo tool is active in the Robustness testing section.
The ”Validated tests” option under the Monte Carlo ”Validation” settings works similarly as the general Acceptance Criteria in the Collection page.
When you click on the “Add validation criteria” button, you are able to add multiple parameters such as minimum count of trades,
maximum equity drawdown %, minimum net profit, and others.
The requirement for the strategies is to pass the Monte Carlo validation’s tests with a minimum success of 80% . Here is an example: