Home › Forums › Forex Strategy Builder Pro › strategy results by fsb

Tagged: fsb
- This topic has 27 replies, 4 voices, and was last updated 5 years, 4 months ago by
 Petko Aleksandrov.
-
AuthorPosts
-
-
September 20, 2018 at 14:15 #6310
edu
ParticipantHello,
i was testing the strategies included in the course “The best 5 strategies”.
This are the results with my broker:
1) USDJPY is the worst one in LOSS

2) EURGBP not so good

3) EURUSD the best one

i tried also the max 0,05

4) GBPUSD not so good

according to this data is not so profitable to use all of them, probably only the eurusd with max 0,05
What do you think? -
September 20, 2018 at 14:39 #6312Petko AleksandrovKeymaster
Hello Edu,
Glad to hear from you. Actually you did not do properly some of the tests, and also it is very important to optimize the EAs according to your Historical data. As I explain in the course, the brokers provide very different quotes/prices, and that is why you will see some bad or negative resutls from the EAs I included in the course. That is why there is a lecture in the course, where I teach how to do proper optimization.
1. Regarding your Historical data, on USDJPY M1, I see that you have only 11479 bars on your FSB strategy, and with EURUSD and GBPUSD you have 65k. Make sure you get more bars for USDJPY, anyway 11k bars for M1 is really really small period of time.
2. The 65 000 bars is limitation from Meta Trader that you can remove. Go to Tools – Options and click on Charts.
Enter 9999999999999 as a number on both, and click on OK:
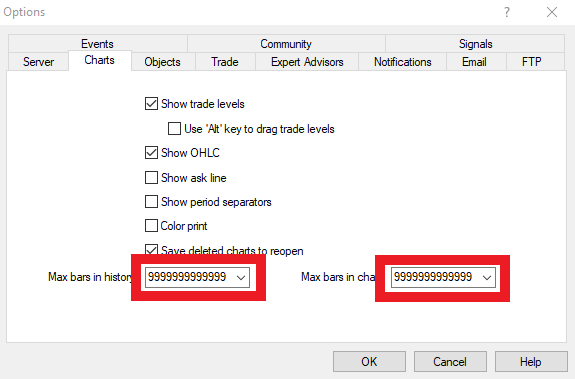
Restart Meta Trader, and press again the Home Key for the small time frames as M1 and M5 Then export again the data with the script for FSB.
And than you should make the test, and optimize the strategies using FSB as I show in the course
-
September 20, 2018 at 15:27 #6315Participant
thank you as always
-
September 20, 2018 at 16:55 #6317Participant
Hello again i did what you said and instead of 65K i have now 70K
i try to optimize the GBPUSD strategy. The equity looks very well (see image) but probably the data aren’t so much.
GBP USD BEFORE:

 <br />how to delete a yahoo account<br />
GBP USD NOW WITH NEW PARAMETERS:
PIC 1#

 <br />how to delete a yahoo account<br />
PIC 2#


What do you think? should i keep yours (with more data) or should i use this?
—————————————————————————————————————————————————————-
With EURUSD doesn’t change anything, and it keeps to look good with 0,03 and with 0,05
—————————————————————————————————————————————————————-
With USDJPY i wasn’t able to do with more than 11k candle—————————————————————————————————————————————————————-
For EURGBP I have 56K for m15 and i tried to optimize it and something crazy happened.
before
 <br />bmw 535i m sport 0 60<br />
after with parameters

 <br />bmw 535i m sport 0 60<br />
 <br />bmw 535i m sport 0 60<br />
what do you think? What should i do?
Thank you
Edoardop.s do you so 1 vs 1 consultant?
-
September 20, 2018 at 18:46 #6318Petko AleksandrovKeymaster
Hello Edu,
you did a very good job! Only on the Slow MA period on the Moving Average crossover indicator. You see the ] sign after the 20. This means that it possible can give you a bigger number if you give it a bigger maximum range.
You better test the parameters from your brokers data. You can run a Monte Carlo test to see if the strategies are not over-optimized.
Also, EURGBP look really good on your data.
What you need to do is just leave the Meta Trader opened, and it will collect you more bars with the time. After that just drag the scripts over the Meta Trader, and place the data in the FSB.
You should try to generate strategies as well with FSB. Did you watch the free lectures that we have on the website from the developer of FSB? They are very useful, and they will give you better understanding of FSB.
I do not do 1 on 1 lessons any more. Simply because, during the last 1 year I had more than 12 000 students joining my courses, and I couldn’t do it physically, and to answer all mails. That is why we started the forum. So this way, when someone ask questions just like you did, all the other students will see the answers and solutions, and the support is much more effective and faster.
Let me know if you have any other questions.
Kind regards,
-
September 20, 2018 at 18:47 #6319Petko AleksandrovKeymaster
Hello Edu,
you did a very good job! Only on the Slow MA period on the Moving Average crossover indicator. You see the ] sign after the 20. This means that it possible can give you a bigger number if you give it a bigger maximum range.
You better test the parameters from your brokers data. You can run a Monte Carlo test to see if the strategies are not over-optimized.
Also, EURGBP look really good on your data.
What you need to do is just leave the Meta Trader opened, and it will collect you more bars with the time. After that just drag the scripts over the Meta Trader, and place the data in the FSB.
You should try to generate strategies as well with FSB. Did you watch the free lectures that we have on the website from the developer of FSB? They are very useful, and they will give you better understanding of FSB.
I do not do 1 on 1 lessons any more. Simply because, during the last 1 year I had more than 12 000 students joining my courses, and I couldn’t do it physically, and to answer all mails. That is why we started the forum. So this way, when someone ask questions just like you did, all the other students will see the answers and solutions, and the support is much more effective and faster.
Let me know if you have any other questions.
Kind regards,
-
September 20, 2018 at 19:15 #6323Participant
hello thank you very much!
i will try to collect more data (i don’t know how much time it will take), i am already using other EA so keep meta trader open isn’t a problem
No i haven’t yet read the lecture but thank you for the suggestion!I will.
————————————————————————————————————————————————————Do you have some video about monte carlo test. i did it after cheched the 20] problem but i don’t know how to read it
this are the results for GBPUSD:
 <br />bmw 535i m sport 0 60<br />
 <br />bmw 535i m sport 0 60<br />
————————————————————————————————————————————————————
This is the EURGBP MONTE CARLO
 <br />bmw 535i m sport 0 60<br />
———————————————————————————————————————————————————–
I think this posts will be very helpfull for many students
Thnk you again no problem for the coaching
regards -
September 20, 2018 at 20:04 #6332Petko AleksandrovKeymaster
Hello Edu,
the free lectures are actually in video on the FSB Pro page: Tutorials for FSB Pro
The results are negative with you in the Monte Carlo because you have used nearly all of the options. And because you have small data, your EAs probably are a bit over-optimized.
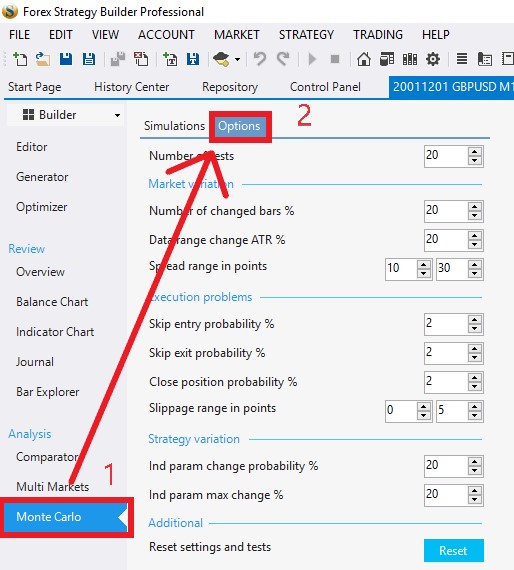
With Monte Carlo I use it normally with the last 2 Strategy Variation, and I remove all the rest. Simply, the Monte Carlo in FSB Pro makes variety of test for the things you choose on the left side. So here it made many different tests with skip positions, slippage and so on. That is why the results is like that.
Give it a try only with the last two, because these are about the strategy. And this is what we care about.
The first one are the Market variations, if you have problems with your historical data(yours is just small) and the spread. Second are the Execution problems, which are about your broker. If you have such, you better change the broker.
Let me know what are the results with the last two only.
Kind regards,
-
September 21, 2018 at 9:58 #6374Participant
Good Morning Petko,
i did the montecarlo test as you said.
The results seems good, what do you think?
EURGBP
First parameter

second parameter

and this was the equity
GBPUSD
first parameter

second parameter

and this was the equity

-
September 21, 2018 at 11:23 #6377Petko AleksandrovKeymaster
Good morning Edu,
yes, this is another thing.
The Randomize backtest starting bar option in FSB shows that the EA is robust no matter when you will start trading with it. Because normally when a trader takes an EA he starts always a t a future moment using it, not during the becktested period.
Randomize indicator parameters is the strongest test for me. It performs variety of test using different parameters for your broker. For example, if you have the RSI period of 9, it will test it with 6,7,8,10,11,12.. You can set the options for the Monte Carlo from here:
-
September 21, 2018 at 11:40 #6379Participant
perfect i am happy to hear that My Monte Carlo tests went good.
I tried also to increase the “number of tests” from 20 to 40 and it keeps to look almost the same. Should i change others parameters?
From your experience now that you have confirmed me that this two strategies look robust, what should i do?
A) Test in real
b) Keep to collect more dataand also should i try to optimize it every month like you do?
EDU
-
September 21, 2018 at 12:13 #6380Petko AleksandrovKeymaster
Hello Edu,
I always suggest the students to test sometime on Demo account before placing on real account. It is important to understand that it is a personal choice and responsibility when one will place the EAs for live trading.
It is good to test it on Demo account until the moment you feel comfortable for live trading.
And yes, you should collect more data, with the time your strategies will become more robust. Also, during the time you collect you can practice with FSB and create more strategies.
Kind regards,
-
September 21, 2018 at 22:43 #6389Participant
Good Evening,
yes obviously i will never ask to you to suggest me to invest. Today I tried the GBPJPY with the expert aadvisor studio after i have tried for 5 days this strategy in demo (every day in loss)
this is the results:
 <br />is ammonia harmful<br />
I tried also to optime (after i watched your videos) but anything changed. What should i try?
i would like also to ask you in a monte carlo test how i recognize an overoptimize strategy?
have a nice weekend
Edu -
September 22, 2018 at 10:06 #6391Petko AleksandrovKeymaster
Hello Edu,
this backtest looks bad. When you optimize in EA Studio, you have an acceptance criteria. Try to remove it, and do the optimization. This way you will see if the issue is there. If it passes, than try to make the acceptance criteria not so strict.
The Monte Carlo itself is the robustness test for over optimization. If it fails, it means that the strategy is probably over-optimized.
Another old method to see if a strategy is over optimized is to change manually some of the parameters in the indicators. If you see huge difference in the equity, this is also a sign that the strategy is over-optimized.
Have a beautiful weekend too!
Petko A -
September 22, 2018 at 14:52 #6401Participant
Wow thank you i wasn’t aspecting a reply on saturday.
So i tried as you said, here i removed the “acceptance criteria” and the equity changed

after i try to put bigger criteria, but anything changed

So i try the montecarlo test. First parameter

then the second (doesn’t look good)

What do you think? Should i remove this from the demo and try another ea?
————————————————————————————————————————————————————–
Before i didn’t explain well, i was asking:If Monete carlo test:
– Give me an equity similiar to my ea’s equity ——-> Good Strategy and not overoptimize
– Give me a different equity ——-> overoptimize strategyis this correct?
Thank you and again have a good weekend
Edu -
September 22, 2018 at 16:30 #6404Petko AleksandrovKeymaster
Hello Edu,
you are missing something with the optimization.
The first time you did it with step of 1, and the second time with step of 10.It is good to do optimization with round numbers as step. But make sure the parameters of the strategy before the optimization to be round as well.
For example, make Stop Loss 80 and Take Profit 70, and then do optimization with step of 10. Same for the other parameters
Your Monte Carlo is just fine. The over-optimized strategies will show total loss with all tests, which is not your case. And yes, you are correct.
No weekend for me during the last years, mate 🙂
Cheers
-
September 22, 2018 at 18:44 #6406Participant
Me too as entrepreneur, i have no fixed day off.
————————————————————I understand the problem and i did it again here the results:
 <br />what is the boiling point for aluminum<br />
it seems that it has huge drawdown (when i use an Ea in real i typicaly use 0,10 lots)
I also did the montecarlo test (that i finally understand how it works)
 <br />what is the boiling point for aluminum<br />
 <br />what is the boiling point for aluminum<br />
How it looks to you? My broker and this strategy work well together?
—————————————————————————————————————————-
Now i have 3 good “looking” EA (EURUSD-EURGBP-GBPUSD), 1 (USDJPY) With too little data (but in demo in 5 days it closed everyday in loss) and this.
Probably i will buy the 99 ea course even if testing all of them would be difficoult considerinf FX blue doesn’t track very well the magic numbers
Thank you again
Edu -
September 23, 2018 at 19:15 #6410Participant
(Please see the previous message before.)New Update, after EURUSD-EURGBP-GBPUSD, i was able to collect more data for USDJPY
This is the before:


This is the after:


This IS Monte carlo:


If you can give me your opinion also about this and the other in the previous post would be highly appreciate
Edu
-
September 24, 2018 at 8:06 #6415Petko AleksandrovKeymaster
Hey Edu,
for the first post:
The Optimization results seems better, and I think the Monte Carlo looks just normal for the number of bars you have. Later when you have bigger number of bars, the strategies will get more and more robust.
The USDJPY looks so much better. I see on your FSB back test that you have more than 300 count of trades which is a reliable number.
Also, when you perform the Monte Carlo, you can select the last two options together. No need to do it separately.
Cheers
-
September 24, 2018 at 13:40 #6416Participant
thank you again
i saw your new 100 Ea probably i am going to buy it with the new discount for you birthday 🙂
-
September 24, 2018 at 19:20 #6417Petko AleksandrovKeymaster
Sure, Edu. Let me know if you have any other questions.
Kind regards,
-
September 26, 2018 at 18:51 #6443Participant
happy birthday, i have buyed your course. Now i have to test again 😉
-
September 27, 2018 at 12:21 #6452Petko AleksandrovKeymaster
Thank you, Edu! Appreciate it. It is always about testing…
Let me know if you have other questions about FSB.
-
October 25, 2018 at 18:50 #6682
 AndiMember
Hello guys!
Interesting topic about the FSB here. I actually succeeded to download some historical data from my broker, they have it on their website. And on M1 I have more than 650k bars. I am not sure if so many bars would be good idea?3
Also, how can I be sure that this Historical data is from the server I am using for the broker?
-
October 27, 2018 at 23:18 #6703
Thetrader
ParticipantHey Andi, I think your data is a bit too much. With so many bars you will get Moreno robust strategies but their daily results will be not that satisfying. The more data you have, the more you limit the average profit per day.
The only think you can test is if your demo account matches with the journal.
-
November 7, 2018 at 10:35 #6805Petko AleksandrovKeymaster
Andi,
keep in mind that you can collect long time Historical data from one server from one broker, and at one moment if they move your account to another server, or if you open another live account it could be on another server.
Normally the broker should notify you about that, but I wouldn’t trust it.
Anyway, Thetrader is right, the more bars you have, the better, but your profit per day will reduce. Simply, the FSB Pro looks for such strategies that are working profitably over the whole period, which cause smaller daily profits.
Kind regards,
-
December 12, 2018 at 9:31 #7617AndiMember
Thank you indeed, I missed to see your answer Petko.
So should I reduce my Historical data? I guess this way I will put more weight on the recent market data.
And by the way FSB is the best tool I have ever used in trading.
-
December 12, 2018 at 22:34 #7650Petko AleksandrovKeymaster
Hey Andi,
Glad to hear from you again.
Yes, it is not bad to reduce the data. In EA Studio the maximum is 200 000 and that is for a reason.
In FSB Pro I go maximum to 300 000 on M1 chart.
Yes, I know FSB Pro is fantastic strategy builder…keep in mind that I tested it long long time before placing it on our website.
-
-
AuthorPosts
- You must be logged in to reply to this topic.