Bollinger Bands strategy that every trader can use
Hello everyone, today I will talk about a simple strategy that I recently created with Expert Advisor Studio for the Bitcoin. This is a Bollinger Bands strategy, a very simple one.
Just one entry condition and one exit condition with the Williams Percent Range, we have a Stop Loss and a Take Profit. You can see we have a stable balance chart and the statistics for this Bollinger Bands strategy are quite satisfying.
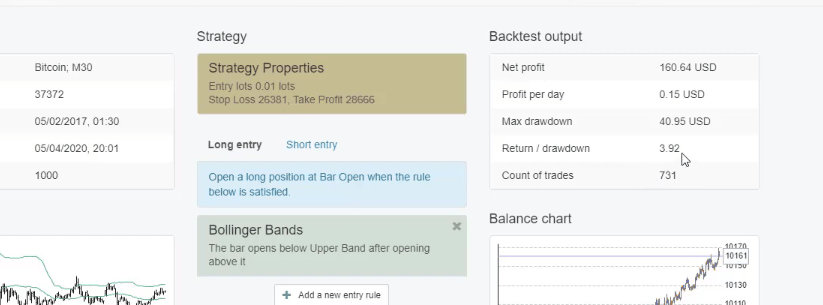
Statistic for the Bollinger Bands Strategy:
- 731 count of trades
- return to drawdown ratio 3.92
- maximum drawdown of $40
Now, this strategy was created for my Bitcoin trading course where I include 99 Expert Advisors, and today I will describe this strategy for everyone who wants to trade it manually or everyone who wants to trade the strategy automatically with Expert Advisor.
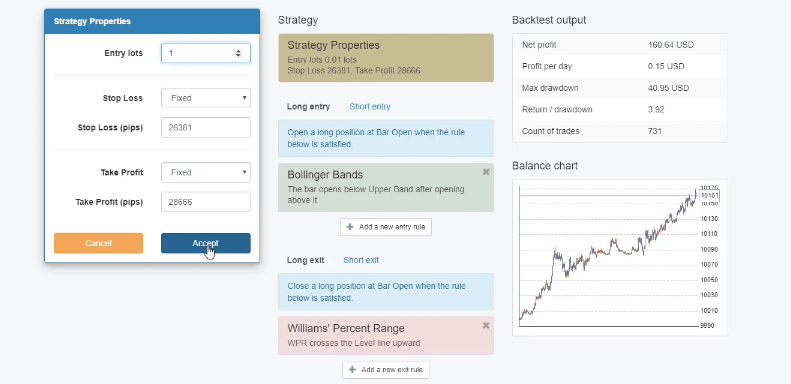
As strategy properties, we have entry lot set to 0.01 which is the lowest risk so I will increase it to 1 lot or this is one complete Bitcoin. This way you will see what results you can achieve with this strategy if you are trading a complete Bitcoin.
What are the Over-optimized strategies
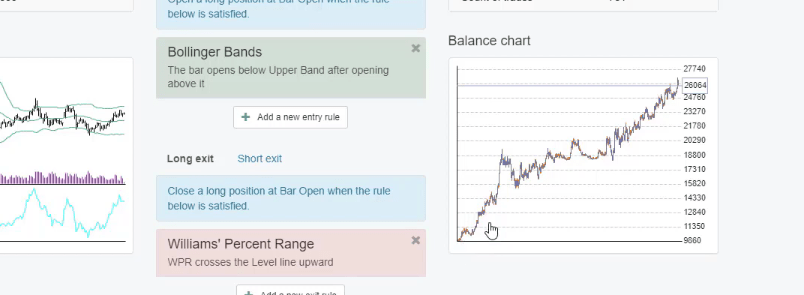
Our balance chart shows very well that the backtest of this Bollinger Bands strategy shows profit of over $16,000 because the account started at $10,000.
As well, as a Stop Loss and as a Take Profit we have $263.81 and $286.66.
What I prefer to do is to round the numbers and I will do this for the Stop Loss and for the Take Profit. There is no huge difference in the balance chart which shows that this Bollinger Bands strategy is not over-optimized.
For the beginner traders, over-optimized strategies are those that have perfect parameters for the Stop Loss, the Take Profit, the entry rules and the exit rules, so it will show a great balance chart.
We avoid trading over-optimized strategies because usually what happens with these strategies is after we place them for testing or real trading, they start to lose.
Now, the Bollinger Bands use this period of 39 and deviation of 2.03, I will increase it to 40 so it will be a round number and I will decrease the deviation to 2, round number and I will see what are the results.
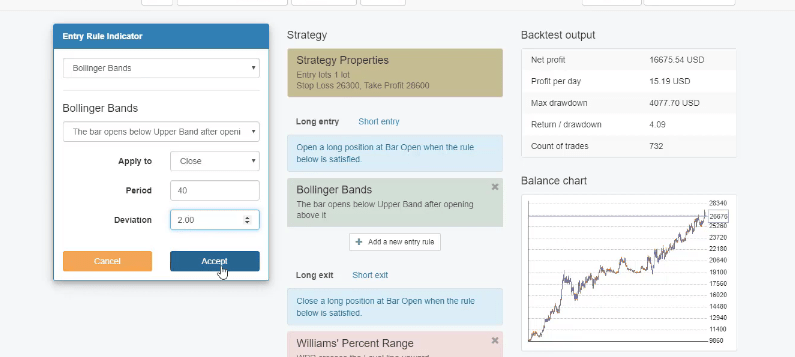
Again, not a huge difference on the balance chart but I used round numbers.
Having round numbers in this Bollinger Bands strategy will make it easier to remember for everyone who uses this strategy for manual trading. For those of you who want to use this strategy as an Expert Advisor, it will work faster because simply, the calculations will be easier and faster.
Difference between the long trade and the short trade in the Bollinger bands strategy
The period of the Williams Percent Range is 47, I will round it to 50.
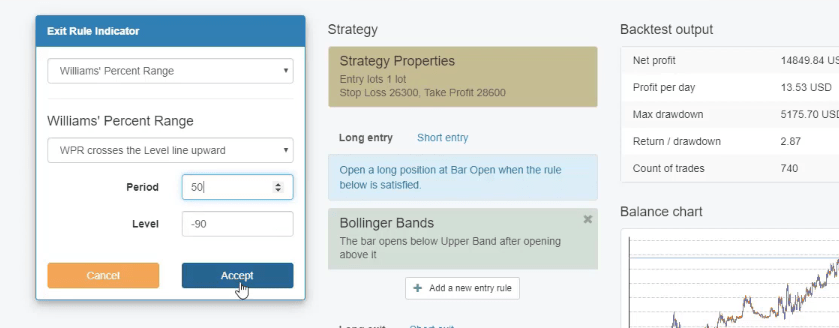
And again, the balance chart remains stable showing upwards. Now, the rules for this Bollinger Bands strategies are that for the Bollinger Bands, we want to see the bar open below the upper band after opening above it.
And I will demonstrate this over the chart. For the long trade, we want to see a bar that opens below the upper band after opening above it and below we have a great example.
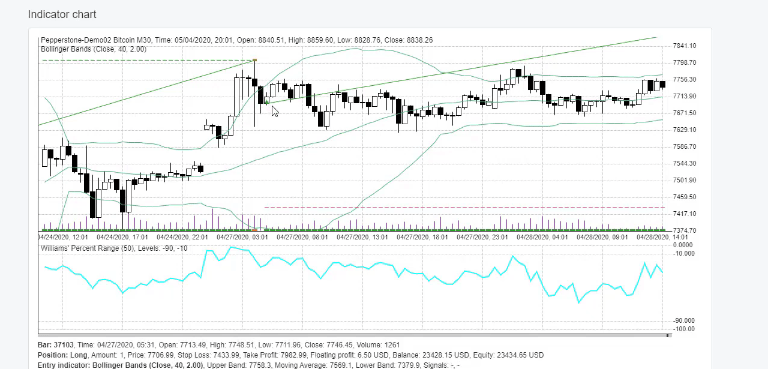
The price is going upwards and the Bollinger Band usually opens its bands when there is volatility.
The price went over the upper band and when it went inside on the first bar opening we have the entry condition. After that, the price continued higher and we have the Take Profit hit.
For the short trade we have the very opposite thing.
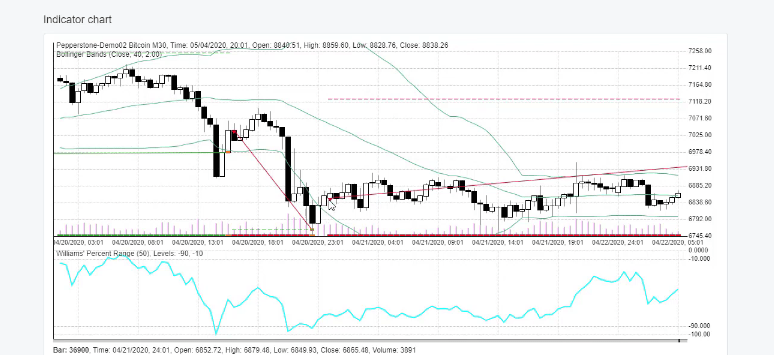
When the price is below the lower band and it gets into the bands on the first bar that opens above the band, we have the sell trade. In this case, this trade went on a loss but not such a big loss.
The indicator chart ilustrates the BB strategy
The Stop Loss was not hit. We have the exit condition which is with the Williams Percent Range.
To make it clear, for this Bollinger Bands strategy, the exit condition is when the Williams Percent Range crosses the level line upwards, this is for the long trade. And for the short trade, we have the Williams Percent Range crosses the level line downwards.
Now, with EA Studio strategy builder we have a great indicator chart where we can see really clearly where the trades were opened and closed. And this way the traders understand how the indicators work and what they can improve in their strategies.
We don’t see such a backtest on the Meta Trader and it is much more visual to see where exactly the trades were opened and closed not only with this Bollinger Bands strategy but with every other strategy that we use with Expert Advisor Studio.
This is a great, simple strategy for the Bitcoin which I am trading on M30 chart and the great thing with Expert Advisor Studio is that we can export the strategy as Expert Advisor for Meta Trader 4 and for Meta Trader 5.
You don’t need to code the Bollinger Bands strategy
One click, I have the ready code of the Expert Advisor and I don’t need to code the strategy by myself or to hire developers to write the code for me.
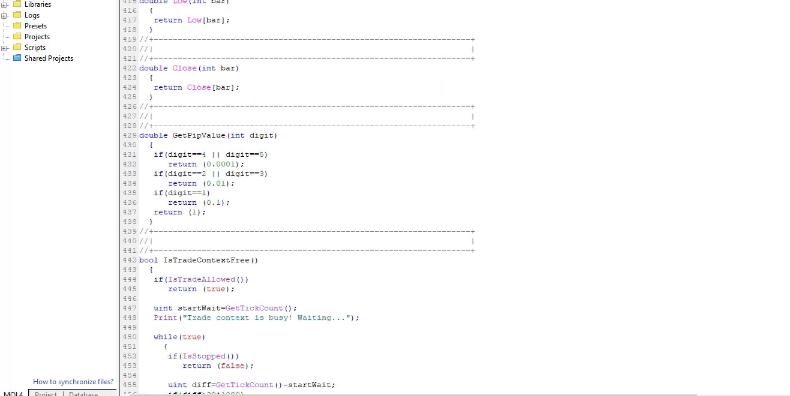
As well, this Bollinger Band strategy is very optimized according to the coding and there are no mistakes. If I click on Compile, there are 0 errors, 0 warnings, and it works brilliantly.
Very quickly, the Expert Advisor is ready for trading on Meta Trader. And for me, it is much easier to trade these strategies automatically with Expert Advisors on Meta Trader because I don’t want to sit in front of the computer following all the entry and exit conditions.
Of course, I can do it but not more than 3 to 4 strategies at the same time and we cannot trade as human beings all the time 24 hours, we will miss a lot of trades. And this is how many traders say some strategies are profitable, some strategies are not.
But if they are trading the strategies just 8 hours per day, they are missing the rest 16 hours for the strategy.
You can trade a strategy for 24 hours using Expert Advisors
Using Expert Advisors, we can trade such strategies just like this Bollinger Band strategy for 24 hours from Monday until Friday and even Saturday and Sunday when the cryptocurrency market is open. Many brokers offer trading during the weekend.
The best thing is to test this strategy with your broker. What you can do is to build a strategy in EA Studio by adding the entry and the exit conditions. Just select the Bollinger Bands from the list, select the rules.
One more time, for this Bollinger Bands strategy.
- Entry condition: the bar opens below the upper band after opening above it, a period of 40, deviation of 2.
- exit condition: the Williams Percent Range crosses the level line upwards, a period of 50, level -90
- Stop Loss, $263, Take Profit, $286.
It’s a very simple strategy to create and automate with Expert Advisor Studio so it is up to you if you want to trade this strategy manually or you prefer to trade with Robot or Expert Advisor. And in the end, I will show you the statistics of this strategy.
If I go to Report and I click on Statistic information, there are detailed statistics from the backtest output. We have $12.24 profit per day, 2.6 return to drawdown ratio, and as Profit factor, we have 1.16.
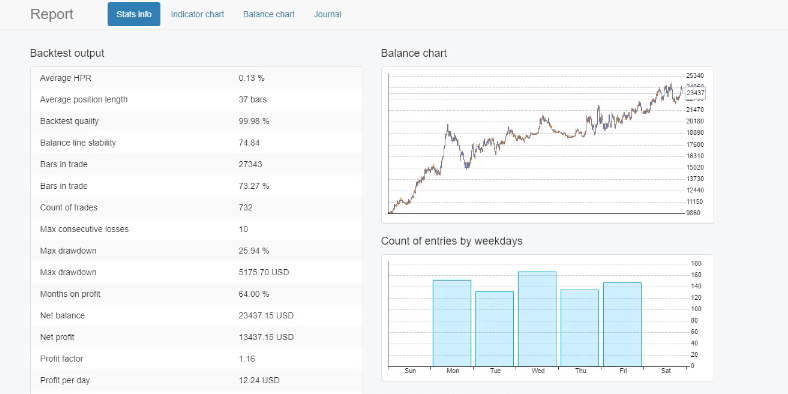
The Profit factor is very important for every trading strategy
Considering that the Profit factor is calculated from the gross profits divided by the gross losses, any trading strategy that has Profit factor above 1 works great. In addition, as statistic, we have the count of entries by weekdays, so you can see it’s a balanced strategy.
This strategy has most profit on Mondays and we have the profit and loss in currency by entry hour, profit and loss in currency by exit hour.
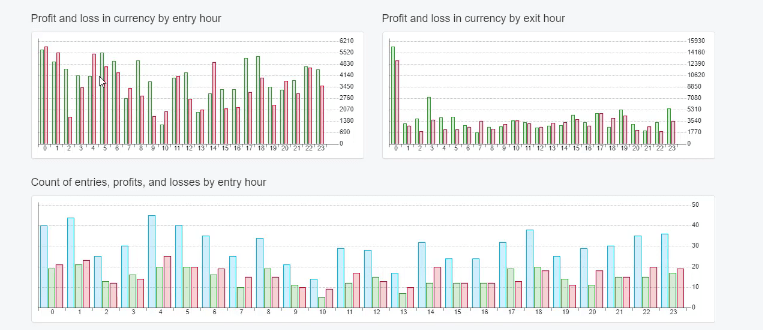
What does this mean? When the BB strategy is trading and I’m looking for the strategies that are balanced, not related to any trading hours. And we can see relatively similar profits during the days.
You can notice in which hours the Bollinger Bands strategy has losses and you can pause the strategy during these hours with some strategies. Personally, I prefer to trade all these strategies all the time, and this way I don’t put any manual work.
Important thing is that when we do Expert Advisors and algorithmic trading, we don’t put any emotions into it because we leave it to the Expert Advisor to execute such strategies as this Bollinger Band strategy.
We don’t close the trades manually, we don’t open the trades manually, we don’t pause the Expert Advisors, and this way you can achieve more stable results. Feelings and emotions are the reason why 95% of the traders, or even more, are losing money daily on the market, on the Forex market, on the cryptocurrency market, and on the stock market.
Visit our trading forum if you have any questions
If you want to create that strategy, it’s very easy. Just open EA Studio, if you haven’t used it there is a free trial which you can use for 15 days.
There is a free course that I recorded recently which you can watch to learn how to use the software better,
then go to Strategy and build in the indicators that are within this Bollinger Bands strategy.
You don’t need to have any trading or programming experience to do that. As well, you can import the historical data from your broker and if you don’t know how to do it, I have a video on YouTube which will help you do that.
If you have any questions, don’t hesitate to drop them in our trading forum. We have many experienced traders there who will share their experience and you are very welcome as well to share your experience with them.
Thanks for reading and I wish you safe trading.
Bye.