
Bitcoin trading example in an online course is a fantastic way to learn actual price action trading.
Bitcoin trading example lecture. Hello, dear traders, it’s Petko Aleksandrov and in this article from the course
Price action trading course: Bitcoin and the Cryptos
It really happens too quickly with the Bitcoin, it went above 10,000 just for a couple of days. And I was not planning to record more examples because I don’t want really to make the course really long.
But using Bitcoin trading example is the best way to learn and repeat the right steps.
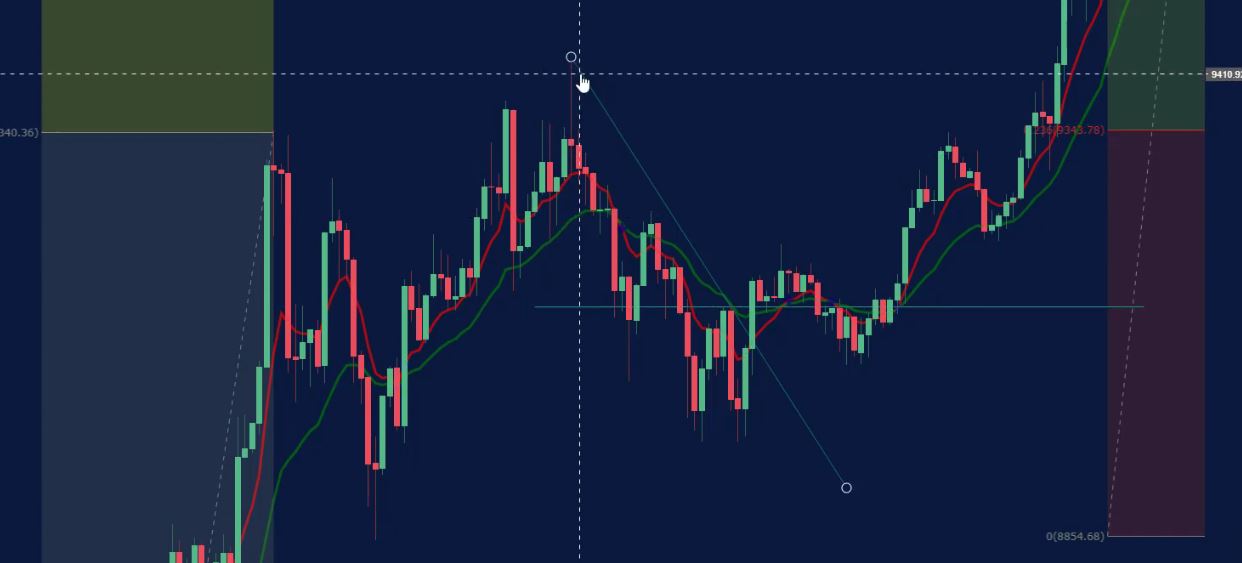
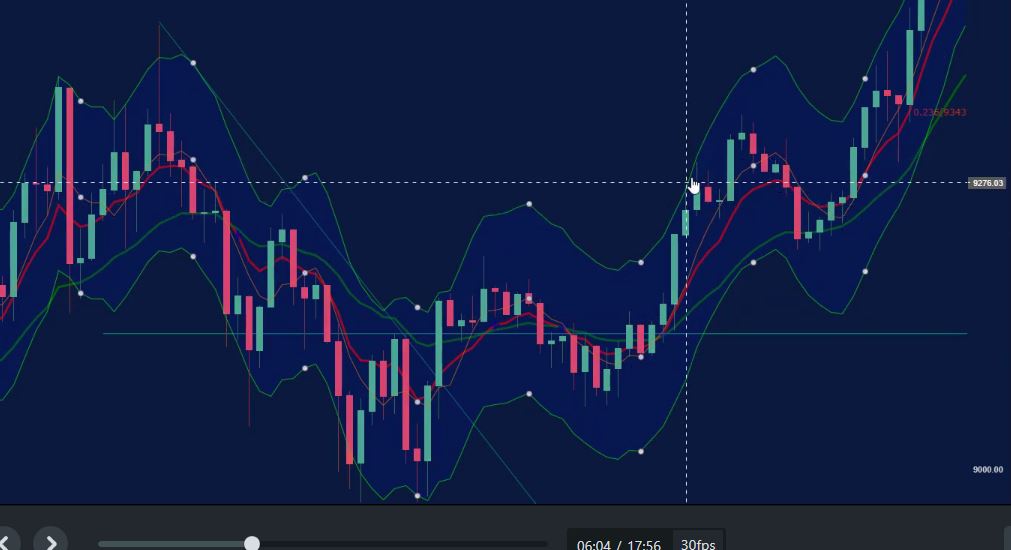
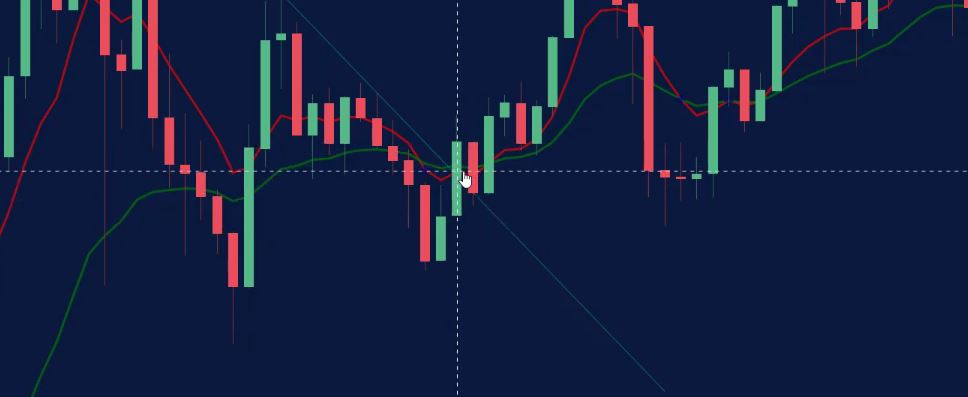
I will go briefly through the setups and just show you what I traded. So here was the setup from the course.
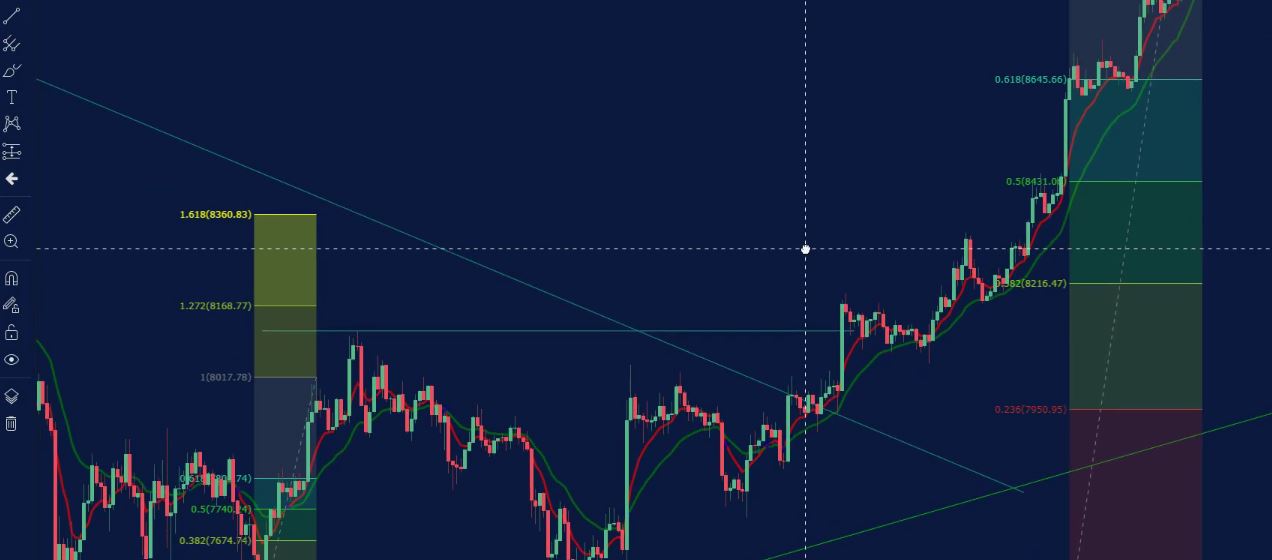
There was the failure of the recent low, the cross of the EMAs, the break of the counter-trendline, the break of the recent high, and then the price continued higher.
All of the 3 trades were profitable. I took one with the envelope, the next one I took on the second Fibonacci target and then with the third one, I was trading the Stop Loss and at the same time, I used the next Fibonacci which actually is much bigger because the price continued higher. So I had to fix it and redraw it.
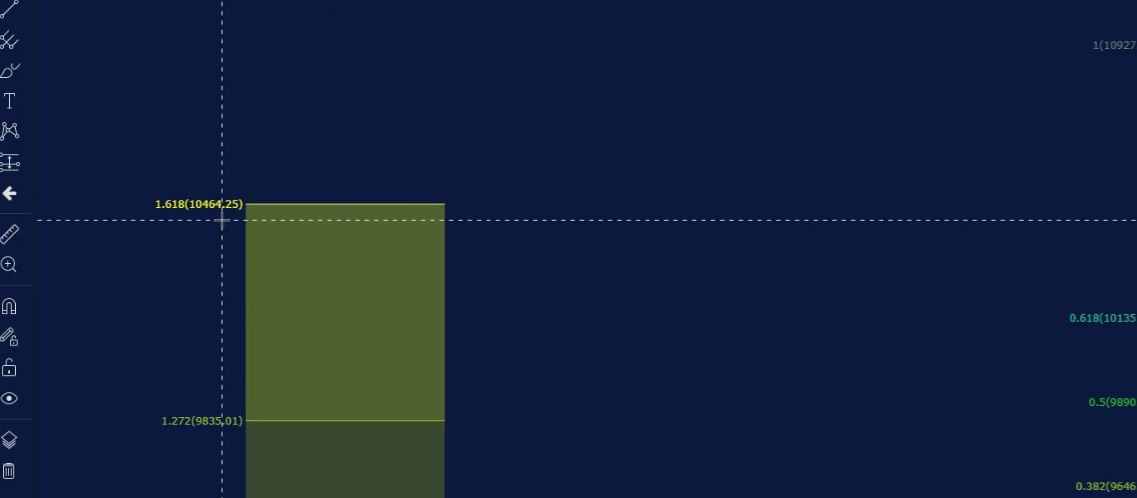
Let me show you where exactly it is. The Bitcoin price hits and then the end of this move is right over here.
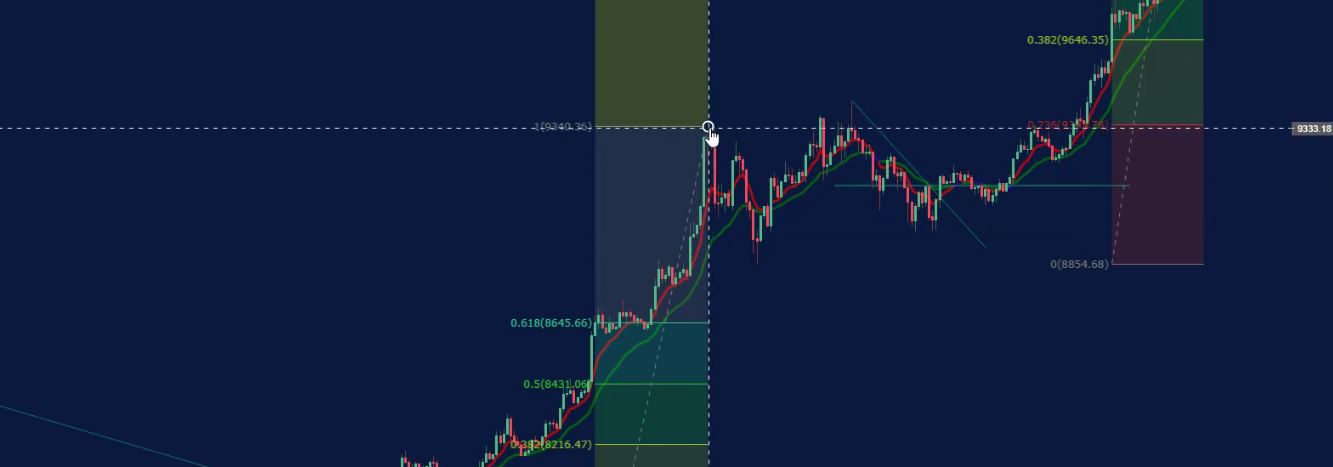
So this Fibonacci got much bigger.
Drawing the counter trend line for this Bitcoin trading example.
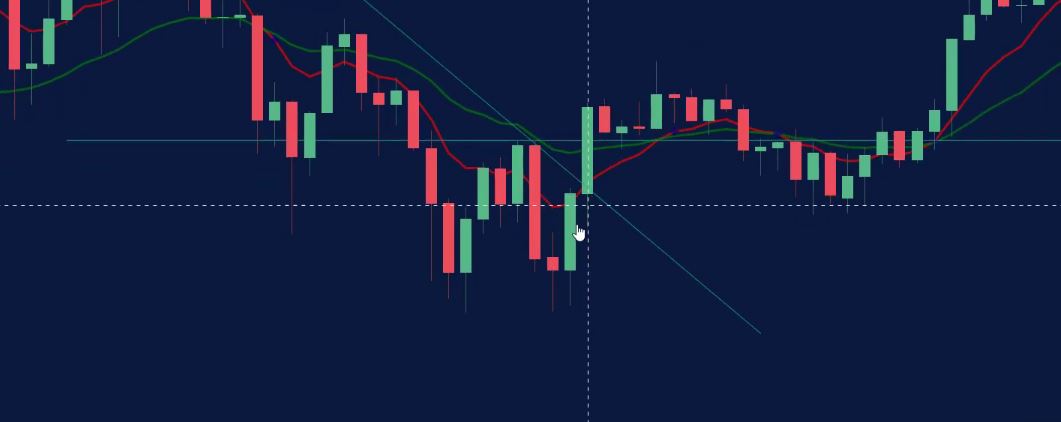
Now, what happened then? The price had a pullback. And here I didn’t really see a nice setup to enter into the trade. I’m talking about this zone over here,
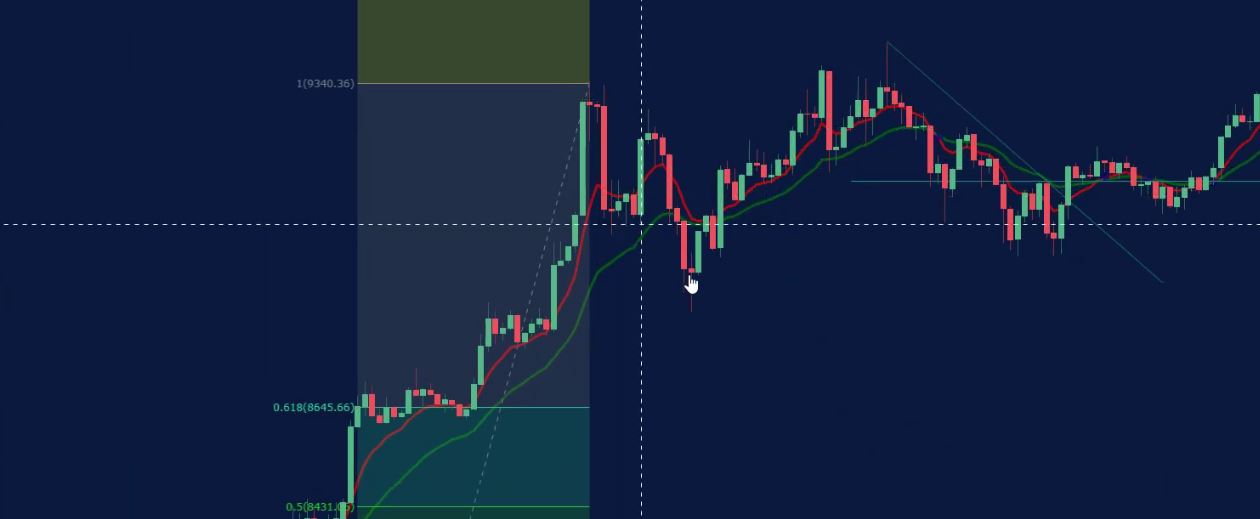
So if I had to draw a counter trend line and let me just show you, it’s something like that.
And even drawn like that, there is no failure of the recent low.
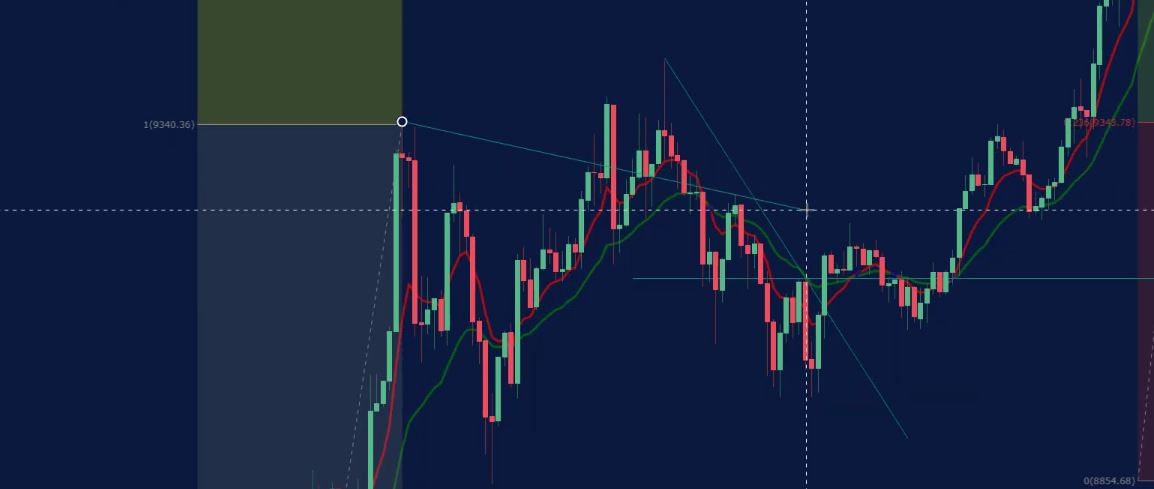
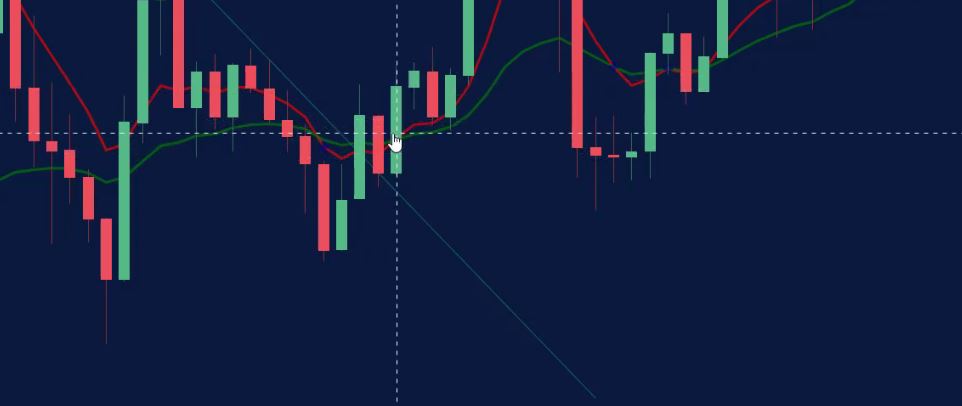
So there is a low and then we have a lower low. So there is no failure of the recent low during this period of time. I just waited for another counter trend line, another opportunity, which was a great Bitcoin trading example. It came a little bit after that right over here.
This was a great counter trend line, which is my favourite price action trading technique.
I had 1 horizontal line on the previous bar which I used as the recent high. So there is a series of lower highs and lower lows so I’m waiting for the failure of the low. And there is a failure of the recent low.
The price fails to take this low very close to it but it’s still a little bit higher. Probably you will need to zoom it more so you will see the difference sometimes when the levels are very close to each other.
The red candle, the spike below the candle, is just a little bit above the other one. Which for me is a great failure. Very close to it could be accepted as a double bottom if you want. Even if I’m not a fan of these old patterns.
The impulsive break is what we are looking for
And then what happened, the price broke aggressively. There’s an impulsive break, impulsive break actually of the counter trend line and the recent high with one candle.
So this is really the impulsive break, this is what I’m looking for, the impulsive break of the price. It breaks the counter trend line and it breaks the recent high. And at the same time, it closes on the extreme. This is a great Bitcoin trading example that I can give you.
What means an impulsive break in price action trading?
- long bar
- close on extreme
- crosse important level
- huge volume
On the break of the counter trend line, I have entered with 33.3% then on the break of the recent high, I have entered the 50%. And what’s interesting is that the EMA cross came later. So 16.6% came after the other 2 entries.
At the opening of this bar, what happened, the price broke. I entered 2 times, the EMAs were not crossed and then they crossed over here so I entered on the opening of this bar with the 16.6.
Keep your chart simple.
Now, obviously the Stop Loss was below the recent lows. Now, I could have kept them but that’s quite a huge distance. So if the low was closer to those, probably I’d have placed it just below it.
But this is a huge distance. I didn’t want to give such a huge Stop Loss, so I have placed it below. It’s below the 9,000 of round number which is great. So my Stop Loss was at 8,940. Below the 950 round number.
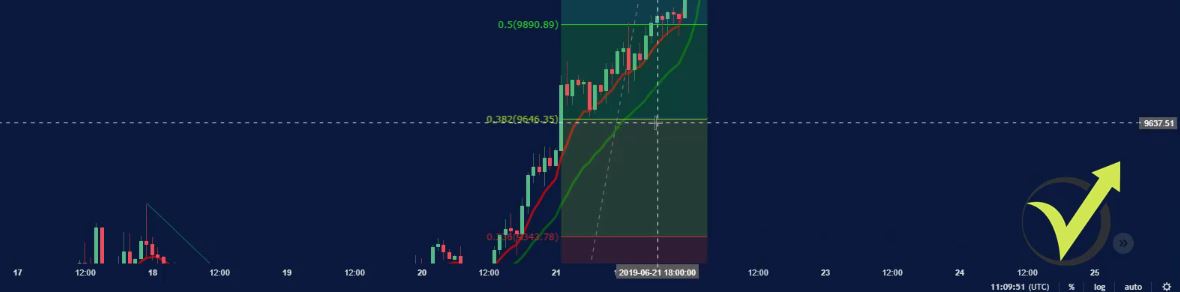
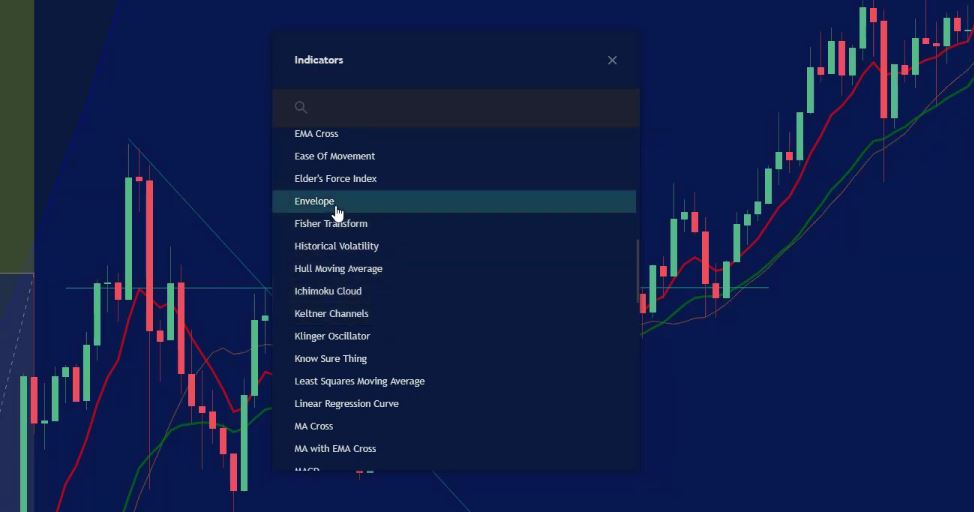
And then what happened, the price continued higher. I had the envelope, of course, to take the profit of the 33.3% position, and let me just place it over the chart. I just remove it when I’m not using it because I really want to keep my chart more simple.
And the envelope is quite huge by default. Let me just change it very quickly. So we said that for the envelope we are using the inputs of the length of 5 and the percent of 1.
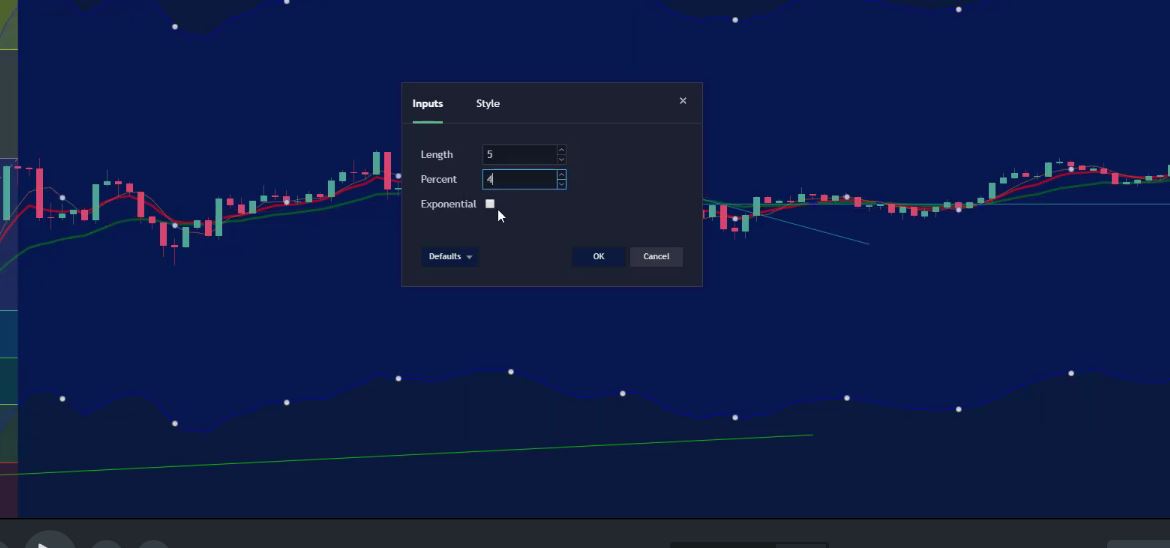
The round numbers matter in Price action trading.
And then for style, I have used green. So it’s the length of 5, percent of 1.
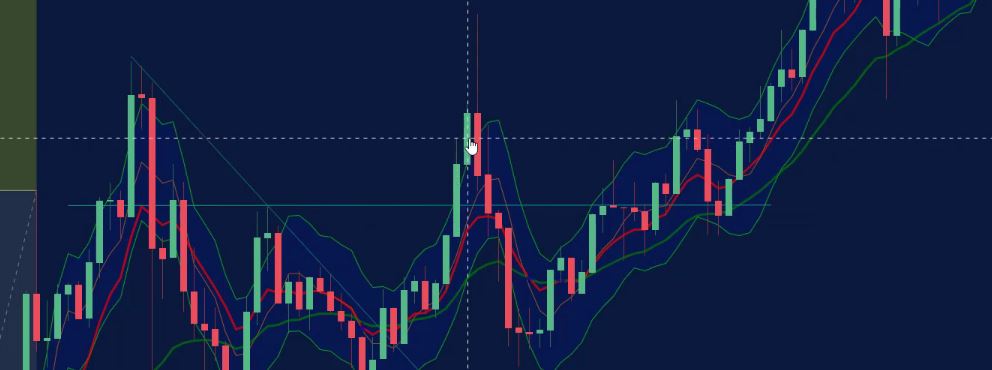
And what happens, you can see that the price here was very close to the envelope.
However, on this candle, there was a touch. So I have taken the profit, this is the profit from the break of the counter trend line right at 33.3%.
Let me remove now again the envelope so it will not mess too much the chart. And then the price just continued higher. My Stop Loss was trailing behind.
You can see here, we have a higher low confirmed when the price broke this high. So my Stop Loss came here. Then it came here and then it was really hard to trail it because the price just went straight up.
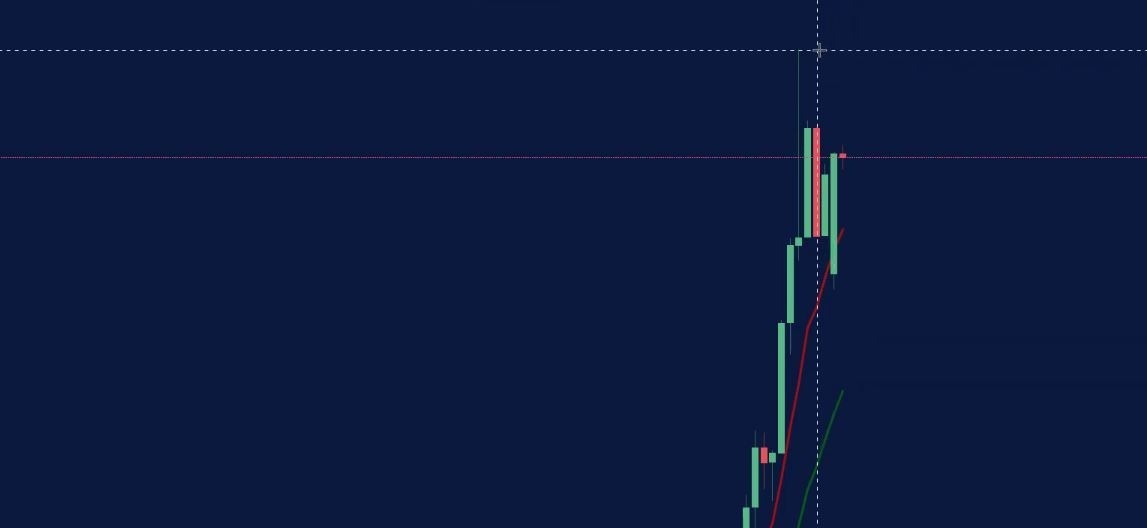
It went above 10,000 actually right over here with this huge candle. So this is what I’m talking about, the round numbers. They really matter. You can see how the price goes towards 10,000.
Take Profit and Stop Loss are must if you are a beginner trader
And the moment it broke 10,000 and just went like a rocket up. Once the 10,000 is broken, it just went straight up with over $700 just for 3-4 hours.
However, my Take Profit, the second Take Profit that I have from the previous Fibonacci, so this one was still not available at this moment. I didn’t have this Fibonacci at this moment. The second Take Profit was at 10,464 is the price and I had the Take Profit at 10,440.
Again below the 50 even if the price went higher, this was a really great move that I got here. This was the Take Profit of the 50% of my Bitcoin trading example trade. And then my Stop Loss was below the recent low
Trailings Stop Loss is useful in Price action trading.
And then I really didn’t have a place to trail the Stop Loss so for the rest 2 positions, I kept it there. This trade was closed, the 50% was closed. And I had the last one with the 16.6% remaining and the Stop Loss was still right here.
Then you can see what happened with this Bitcoin trading example. The price failed to take this high which gave me another opportunity of a counter trend line.
But I moved my Stop Loss for the last position over here below this low, just when this high was broken. And it was broken at this moment from the spike of this candlestick. And actually, when it was broken, I have moved it below the low.
So I kept this last trade for much longer. My Stop Loss is below this recent low. You can see above I don’t have another higher low to move it. So the price during the night reached nearly 13,000.
A long candle talks about in Price action trading.
You can see again the round number matters, it bounced from 12,960, something like that. It couldn’t reach 13,000. And my Stop Loss for this last trade is still there.
Of course, if the price reverses down to 11,000, actually it’s below 11,000 as it’s a round number. It is at 10,990, but I consider it below the low.
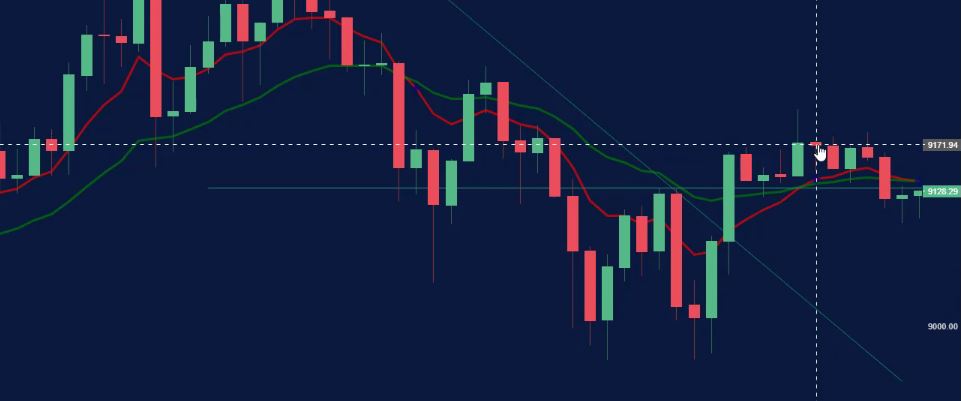
So if this 13,000 had broken, I would move the Stop Loss. And I have the very same thing for the 3 new trades that were opened. So here at this counter trend line, I had another Bitcoin trading example.
While I had my last trade remaining, I had another setup and I used it. You can see here I have a counter trend line, the price failed to take the low. It is like a really perfect situation for my system.
The price fails to take the low, we have an impulsive break. Even if it didn’t close really on extreme, you can see that there was a small spike. But still it’s a long candle, crosses the counter trend line and here I had the entry.
Exponential Moving Averages will be used in this Bitcoin trading example.
Now, after that the price just retested, the counter trend line continued higher, the cross of the Exponential Moving Averages happened. And on the opening of the next one the cross was confirmed and here was the 16.6. So the 33.3 was here with the break of the counter trend line.
And on the opening of the next one, I had the 16.6 because of the cross of the EMAs.
This is the most recent high. On the break of it, you can see again an impulsive break. This is exactly what I’m looking for, impulsive breaks, I had the 50% of the position.
So my Stop Loss was initially below this low. Then when this high was broken, it moved below the low. Then when the price continued higher when it reached the highs, I trailed it over here and then it is on the same place as I showed to you for the other trade right over here below the 11,000.
The second Fibonacci is my Take Profit
I moved the Stop Loss here after this high was broken. So we have a confirmed higher low.
Let me show you once again where was the Take Profit and I will start with the Envelopes.
Let me just make it quick. As I said, I’m using length of 5 percent of 1, I click on OK.
And you can see right over here I had the entries and the exit was really quick.
Actually, the break of the recent high where I had the 50% went straight out of the envelope.
And this is because really we have impulsive moves from the Bitcoin recently. So this trade was pretty quick, the 33.3%.
But you can see where was my 50% the biggest trade, this one over here that breaks. It was on the second Fib at 12,190. 12,207.86 is the second Fib with to 1.618. But I have placed the limit at 12,190.
The Bitcoin is going up. And there willl be many opportunities as this Bitcoin trading example.
Again, below the round number of 12,200. And then with the last 16.6 which actually here again came after the break of the counter trend line.
So, in this Bitcoin trading example, it was the break of the counter trendline, the cross of the EMAs and then the 50% trade which is the break of this recent high, which is still opened. So I have 2 trades open with 16.6% and the Stop Loss is here for both of them. And the price now is at 12,640.
So this was a little bit longer post but I wanted to share with you my other 2 setups Bitcoin trading examples that I had with the system. The Bitcoin is really going up and it’s a great opportunity to use it. The most important thing is to stay strict with the strategy you follow.
Learn to take the profit!
No matter this one or any other, I stay really strict with the system. Because I don’t know what will happen in the next moment. And the most important thing in times like that when the price just goes upwards and it gives us great opportunities is to learn to take the profit.
Don’t be afraid to place a limit and to take your profit. I have hundreds and thousands of students already. Many of those shared with me when the price of the Bitcoin last year reached 19,000.
They were keeping their trades hoping it will go more and they didn’t take any profit, then the Bitcoin just crashed together with all the cryptocurrencies. Many people lost their money and savings. They just panic and they closed the trades on losses.
So they took the Bitcoin at a good price, hold it for some time, but because they were hoping to get more and more profit, at the end many people closed the trades and sold the Bitcoins on a loss. Because they panicked that they will lose all their savings.
Whether with this system or another, place your limits.
So what I really want to teach you with this course and with the system, is to learn to take your profit. Keep something in mind
You are not going to lose if you take profit. You saw that in this Bitcoin trading example.
Place your limits, doesn’t matter with this system or anything else.
If you use the Fibonacci, or some envelope, or anything that you want to use, or the round numbers, if you take profit and you make some profit in your account you will not lose from that. Of course, it will happen that the price will continue higher as you saw with my examples.
I could have made much more if I had kept all of these trades till at the moment. But of course, I don’t know if the price will go more upwards.
No expectations, no hope, no feelings.
I follow the system really strictly. I have very precise entries and exits with the counter trend line, with the recent high and I have my levels where I take the profit. And at the end in my live accounts, I did some really great profit.
But if you’re really a beginner trader I don’t suggest you risk on the live account.
Watch the complete course Price action trading course: Bitcoin and the Cryptos
Test it always on a Demo, practice first make sure you are confident with the system and you know the details. Of course, you’re very welcome to change anything which you think will be better for you and you will feel comfortable with it.
Thank you very much for reading, if you have any questions don’t hesitate to ask me.
Petko Aleksandrov