
Bitcoin invest: When to sell and take the Profits
Hello, dear investors, in this article I will show you where I decide to sell or where I decide to take the profit. And this is as important as when to buy and when to get on the market when Bitcoin Invest. It’s also the same thing when we get off when we decide to close the trades.
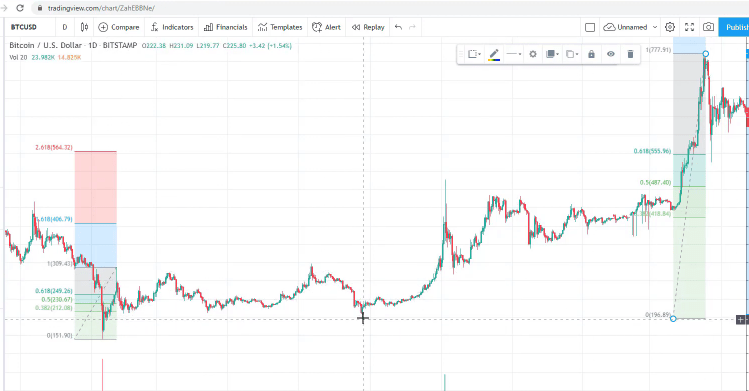
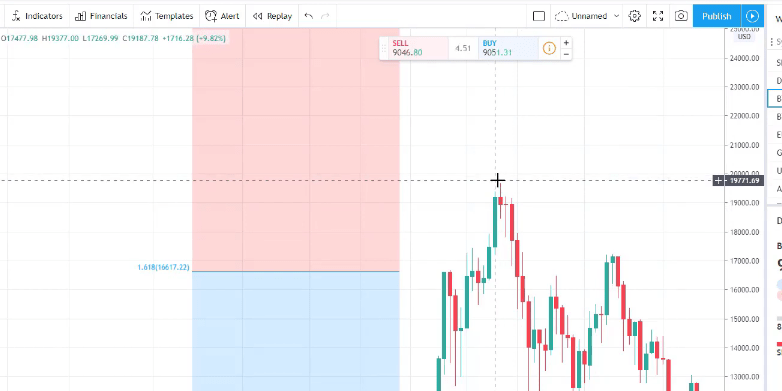
And, of course, we always aim to do that on a profit not on a loss and this is exactly what I want to teach you in this course. So I will go back just where I started this section and I will look for the lowest low right here, the one shown below.
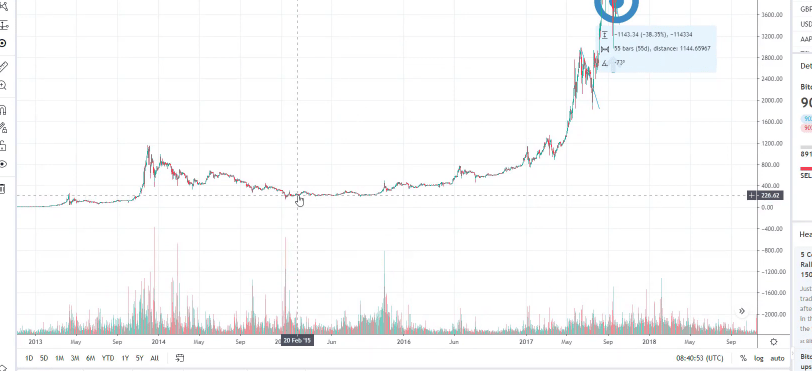
We had an uptrend here. This is really old historical data from 2013 and 2014. I will take as an example just the recent huge move that we had in 2018 and then I will show you what is present in 2020 and how I applied this method of Bitcoin Invest in taking the profit or selling the cryptocurrencies.
So we had a downtrend in 2014, in 2015 it changed and we had a clear uptrend. For this Bitcoin Invest strategy, I’m using is the Fibonacci retracement. For some people it is an indicator, for others it’s a complete theory.
The fibonacci retracement is what I use in this Bitcoin Invest strategy
It’s a method that is very common but I use it just to show me where is the place and when is the time to sell off and to get out of the market and to take my profit.
So what is the Fibonacci? There are different methods of drawing it. Normally, it should be drawn with the direction of the trend but I draw it just the opposite way and I will show you why.
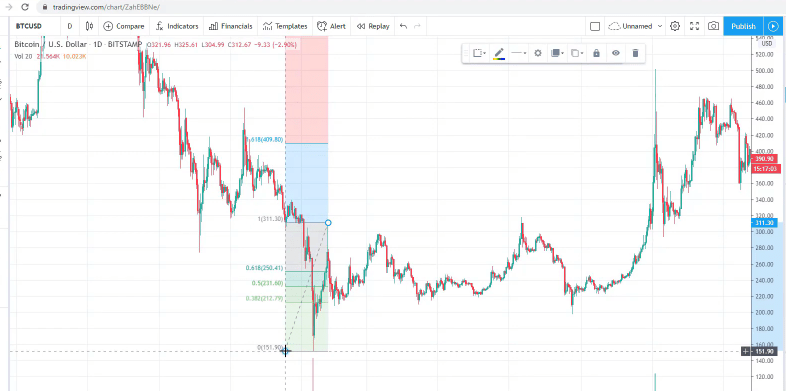
So when you grab it from the trading platform or whatever website you’re using for your analysis, you can draw it from one point to another. And what I take is the first move in the uptrend which is the last move of the downtrend.
And then you can see that I have this middle zone which has the 50 level, 61.8, and 38.2.
And then I have 2 targets. And this is the thing I’m using, it has a target of 1.61 and 2.61.
And in brackets, it shows you what is the price.
So I take the first move and as the price continues, I keep drawing the Fibonacci whenever the price reaches the second target. So the next Fibonacci, I can take a new one or just ctrl + C, Ctrl + V the one I have.
I avoid large drawings on the chart
Normally, I don’t draw them so big because it will take a lot of my screen and if I draw different things, it will be too messy. I keep them tiny.
This is just so that it doesn’t take so much of my screen. So, one more time, I take the first move when the price reaches the second target, at this moment I have a huge move. So I take the top of the move and I draw it until the lowest retracement or this is where the price reached lowest from the fibonacci.
The price continued higher. We have the first Take Profit which worked perfectly in this case. The price just reached it and dropped down. And then we have the second target.
And where is the end of the move? I think it’s where there is some pullback. So with the next fibonacci I use the other method. Ctrl + C, ctrl + V, and I can drag it a little bit faster from the top until the lowest point as shown below.
Zoom your screen to place the Fibonacci precisely for the Bitcoin Invest
Try to make it precisely. I will not do it like very accurately right now because the lecture will get longer if I zoom it every time to put it in the right place. But when you are doing it make sure to zoom and to put it on the right spot.
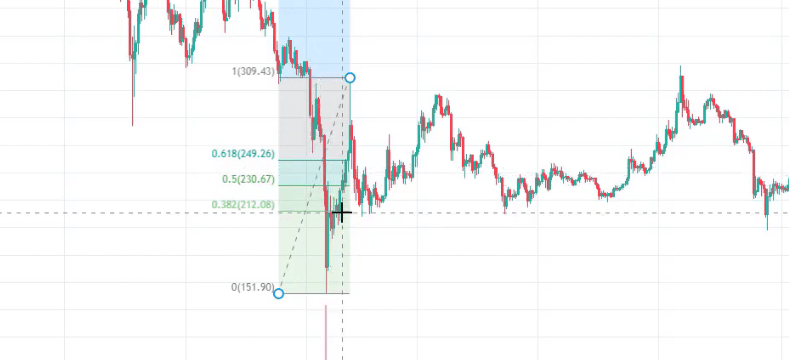
So, one more time, the price reaches the second target and I take the next high, and then I draw it back to the lowest retracement.
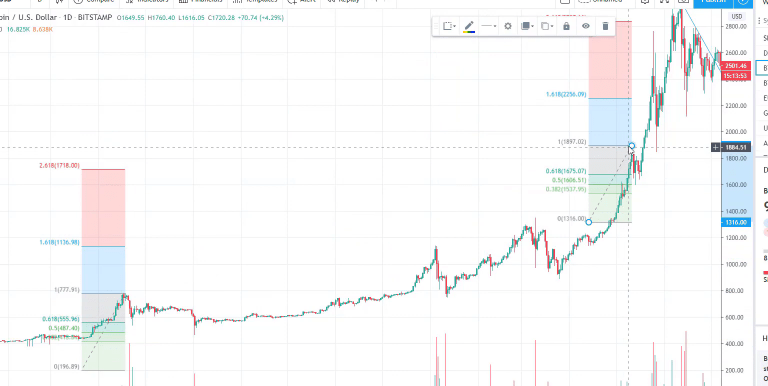
This Bitcoin invest strategy for profits worked perfectly with the first Take Profit or for the first target, and then the second one is nearly at the end of the move. And if you have both, taking the profit at this level would be just fantastic.
And then it might give you new opportunities, there is a nice counter-trendline here, failure of the recent low and then you can re-enter and continue higher. What happened then where the price reached about 4,200 and something? So again I will ctrl + C and Ctrl + V, and I will take it from the next top.
You can copy a previous fibonacci and paste it
It reaches here, the top and the lowest retracement are shown below.
The price pulled back so there is the lowest retracement.
And then there is another retracement that went below that point. And then what happened is we have the new targets and I really hope that you get my point here, how I continue higher. And there is just one more fibonacci that I had in this case.
Let me take another one or as I said, you can copy a previous fibonacci.
So we have the second Take Profit and we had a top. This is the lowest point. So we had a new top, the price failed, and it was a very negative candlestick.
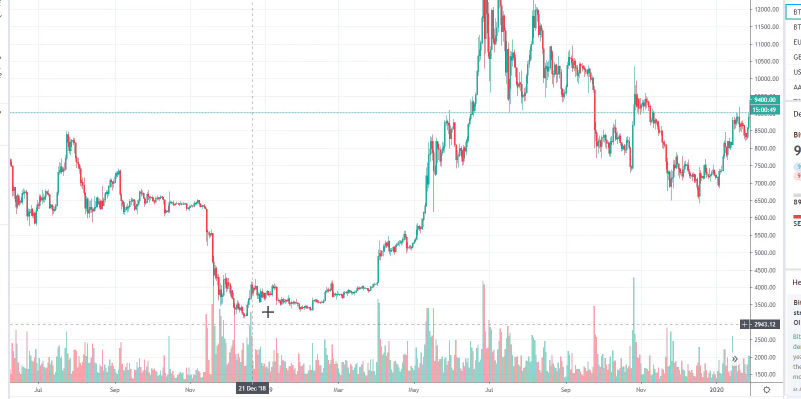
However, the price continued higher. I guess everyone remembers this time when the people were totally crazy about the Bitcoin. Everybody was buying, even people that never ever participated in the market bought so much Bitcoin. And unfortunately, many people lost after that. They did not use any Bitcoin Invest strategy.
Round numbers matter with the Bitcoin Invest
The first target was reached very successfully but then the second one was not reached. And I remember this time very clearly because I closed some of my trades. I sold some Bitcoin and other cryptocurrencies at the first Take Profit.
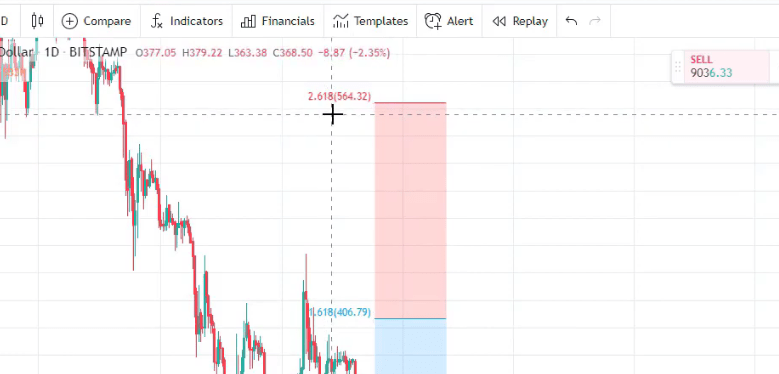
And then the price continued higher but it formed this 1, 2, 3 negative candlesticks and on the 4th one, on the 4th day, which was the 17th of December, I saw that it really becomes negative. And a very important thing happened here at 20,000, this was the round number that the Bitcoin failed to take.
And since then, it never reached it until this moment. Maybe in the future it will. If you’re watching this course later and it’s above 20,000, well it means that it was broken. And if I go to the 10,000, the first time it broke the 10,000, the 10,000 again is reflected.
It broke but this day failed to close above the 10,000 which was a negative sign but still, it continued higher. And then if I just go back, there are some very important psychological levels like the 3,000. The price failed, and then broke above, then we had at the 5,000.
So keep in mind that whenever there is a round number, it always reflects the price and you need to be really careful. And especially if you see the price failing to take some round number, you should close the trades and you should take your profit.
Don’t risk losing your profit
Take the profit, don’t take the risk to lose your profit. There will be new opportunities. And there were so many new opportunities after that with the Bitcoin. It went down.
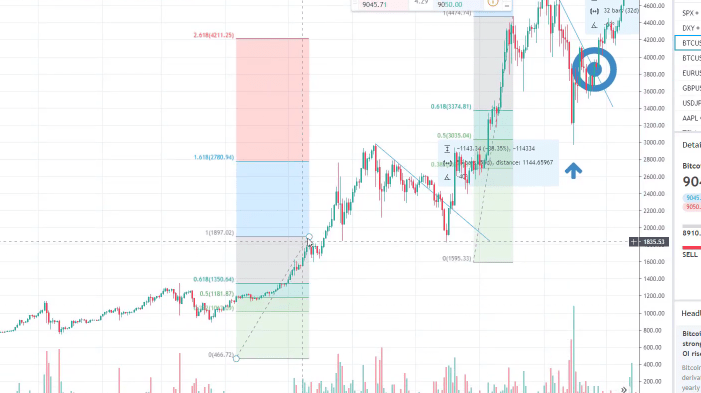
And actually, with the downtrend, when the price is very negative as it was in 2018, I use the brokers and the CFD trading where I can actually trade on the opposite direction.
And I do all I’ve shown in the opposite. I draw the fibonacci the opposite way and I draw the counter trendlines the opposite way.
Counter trendline fails to take the high, great opportunities sell. But this I show in my other Bitcoin price action trading course where I’m showing CFD trading and where I show a very similar strategy. But here for the investing course, I wanted to simplify it and to make it easier for everyone.
Now, in the next lecture I want you to do the fibonacci drawing for the period after 2019, starting from here until the top.
And please share some screenshots so I can see if you have done it properly. Do this assignment, it will be good practice for you. You can post the screenshots in the comments below.
Starting from December 2018 and 2019 until June, the top that we had where the price failed to take the 14,000 which is again a round number. And then we had another negative trend with the Bitcoin, a new positive trend at the end of 2019 and the beginning of 2020.
Coronavirus impact on the Bitcoin Invest
Just play around with the chart, draw counter trendlines, and draw the fibonacci so you will see what were the opportunities with the strategy. And look as well for the failure of the recent low. Now, what I will show you is the recent fibonacci that I had.
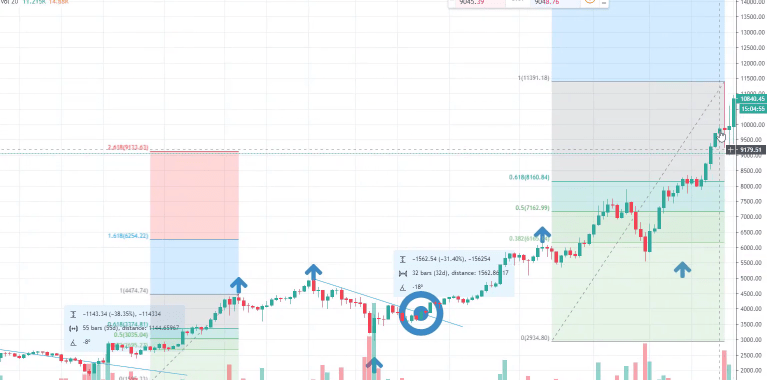
This is the crash because of the coronavirus where the stock market crashed, the cryptocurrencies, and a very huge crash for the Bitcoin. In one day, it fell from nearly 8,000 down to 4,800 and something.
However, after that we had very quickly the uptrend, a series of higher highs and higher lows. And below is my first fibonacci, I will just switch it to hourly chart so you can see it more clearly.
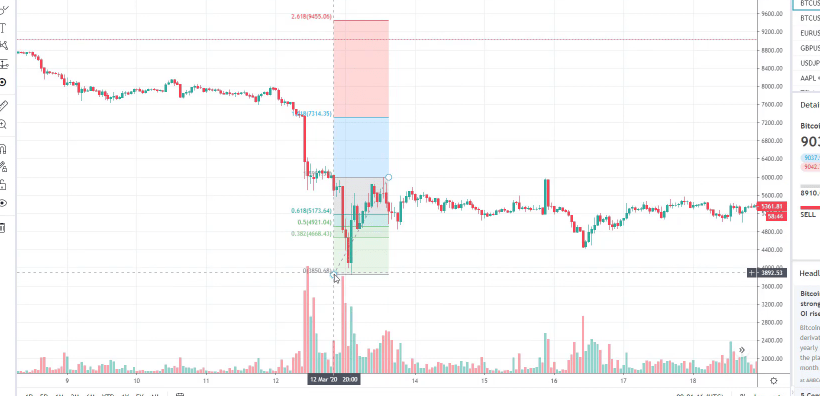
Where is the first Take Profit? 7,314 and 9,455. So it’s up to you which target you want to use, the first one or the second one.
Work on the assignment for practice purposes
If you want to take your profit faster and you don’t want to hold your positions for a longer time, you can use the first one or you can use the second one. I use them both, sometimes I sell some quantity in here, and sometimes I wait for the next one.
For example, once I waited because it is below 10,000. If the target was just above the 10,000, there will be the 10,000 round number that might stop the price. So I don’t want to take that risk and I will be using the first target.
But in this case, I decided to wait for the second target because it’s below the 10,000 and I will show you that in the next section. Make sure you do the assignment now because it will be useful to you to practice. Share it with me and I will give you always some advice and tips.
Thank you for reading.