How to Backtest Forex Trading Strategy?
Hello everyone, in this lecture, I will show you how you can backtest Forex strategy Expert Advisor on MetaTrader & EA Studio.
It is very important to backtest an Expert Advisor before trading with it. And as well, you need to know how to backtest it exactly, depending on how the Expert Advisor works.
As I’ve said, these Expert Advisors work on the opening of the bar. So this is the option we will be using.
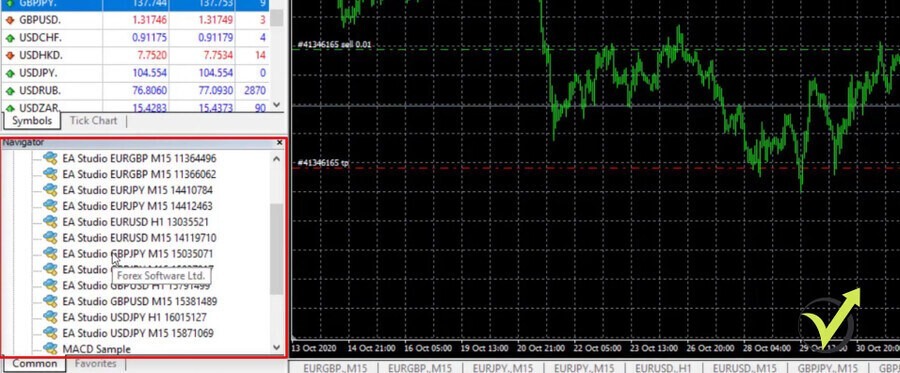
Now, if you want to backtest Forex strategy Expert Advisor, you need to click over the chart, go to Expert Advisors and go to Strategy Tester.
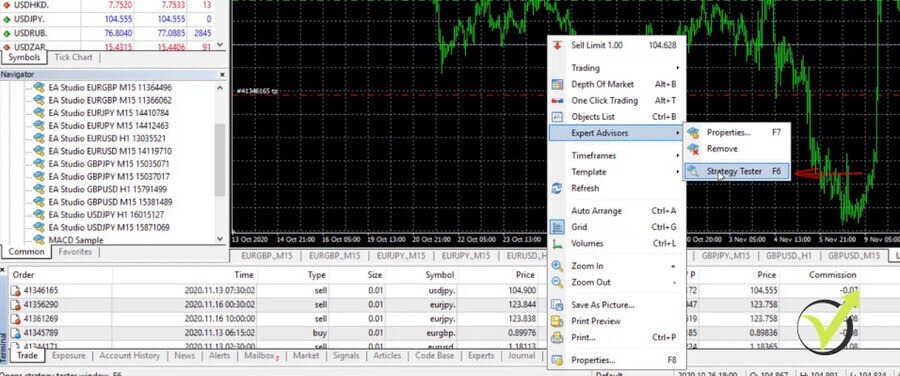
A new window will pop up below and usually, everything is fulfilled automatically.
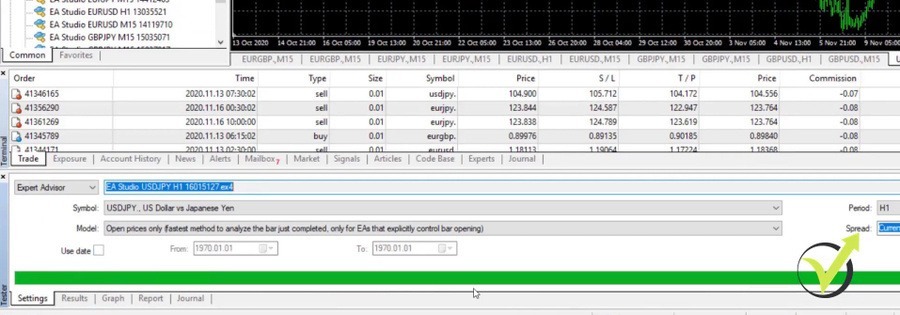
You can see the Expert Advisor, the currency pair, and Model is Open prices only because these Expert Advisors open trades on the opening of the bar. So they use the open price.
And if I click over it,
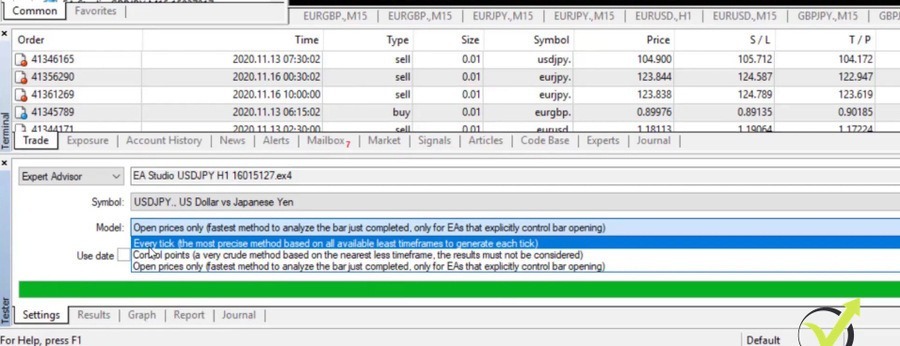
you will see that we have every tick, the most precise method, it says, but there is no tick data in MetaTrader. It’s a kind of an illusion here that we actually don’t have big data, but there is such an option. So, don’t go for it. So we have control points and we have on the bottom the open prices only which says the fastest method and you will see actually how fast it works. On the right side is the period, the spread.
The Report
And all you need to do then is just click on start and you see it happens for less than a second. It’s super fast. And if I go to results,
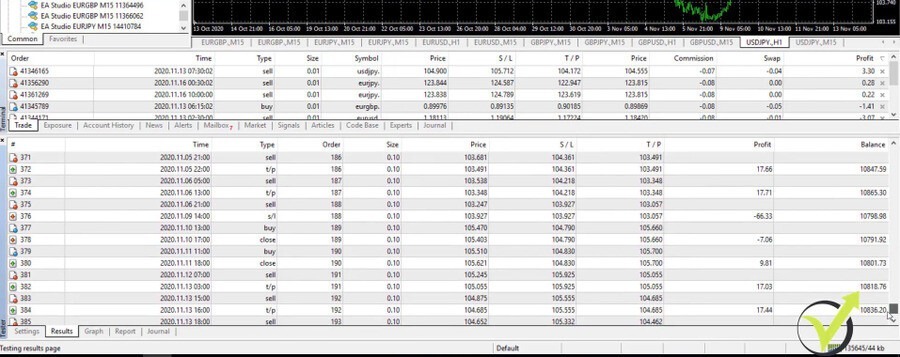
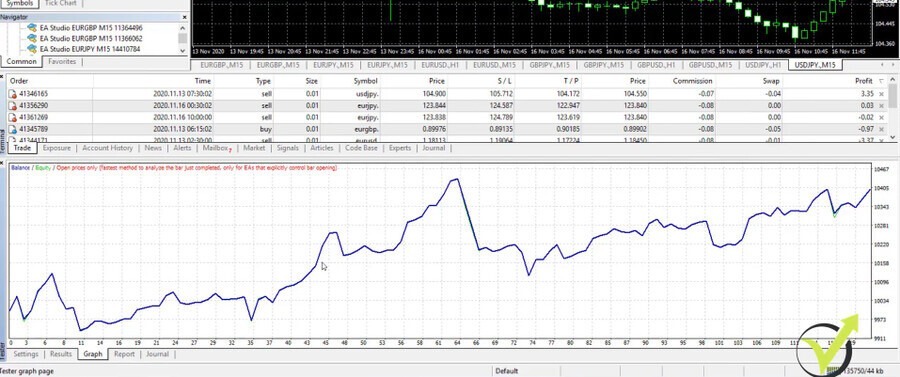
you will see that I see every single trade where it was opened, where it was closed, how the balance line went and how many trades basically I had. And if I go to the graph,
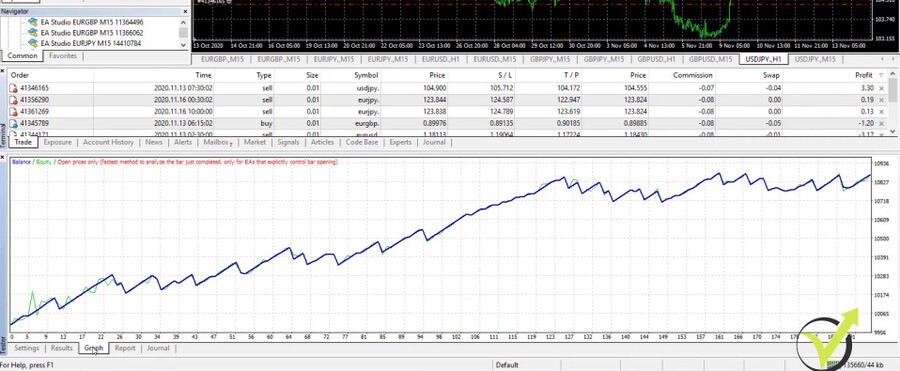
the more interesting thing is you can see how the equity line went with the strategy. It is on profit.
We have as well report where we see some statistics.
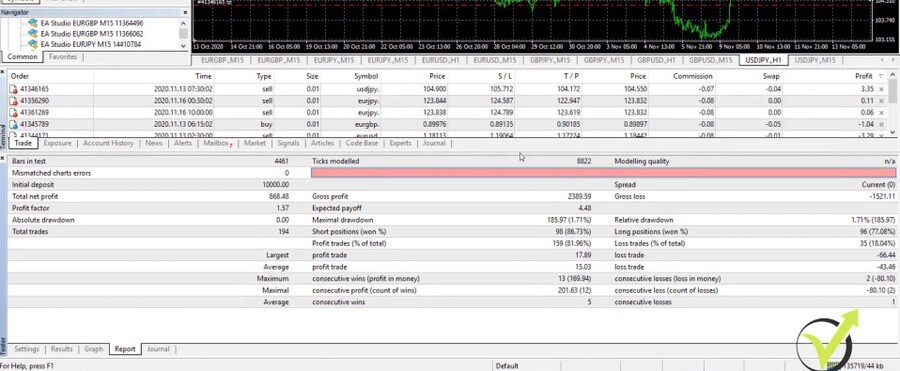
But this is really not enough what we see as statistics. We have consecutive wins, consecutive profit. And what’s interesting here, we have consecutive losses as well. We have the maximal drawdown, which is 1.71% pretty good. But for me, that is not enough
How to Backtest Forex Strategy in EA Studio
Now, I will show you how to backtest a trading strategy in the EA Studio strategy builder software.
But let me close it and I will make one more backtest on USDJPY on M15 for example. I will right-click and go to Expert Advisors and I will go to Strategy Tester. Here it is. All is set automatically and I click on start and let’s see what we have as a graph. Here it is.
You can see the strategy is different. The backtest is different. We have a bigger drawdown right here.
Use Historical Data to Backtest Forex Strategy
I guess we will see in the report. Maximal drawdown of 3.07%.
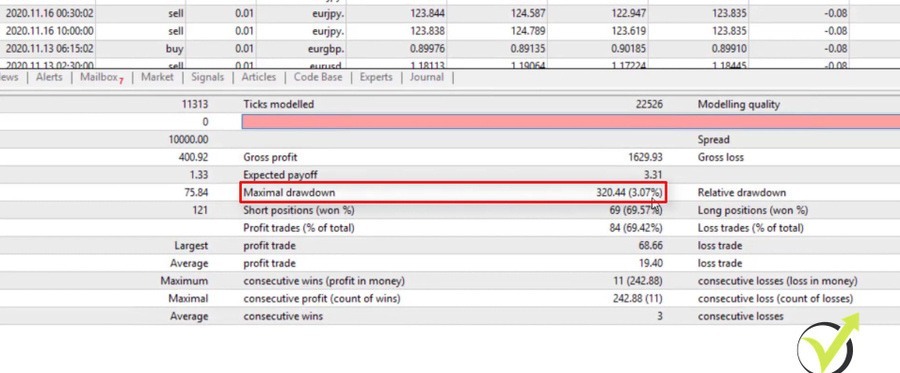
But again, this is not enough as statistics and as well it is not enough as total trades 121.
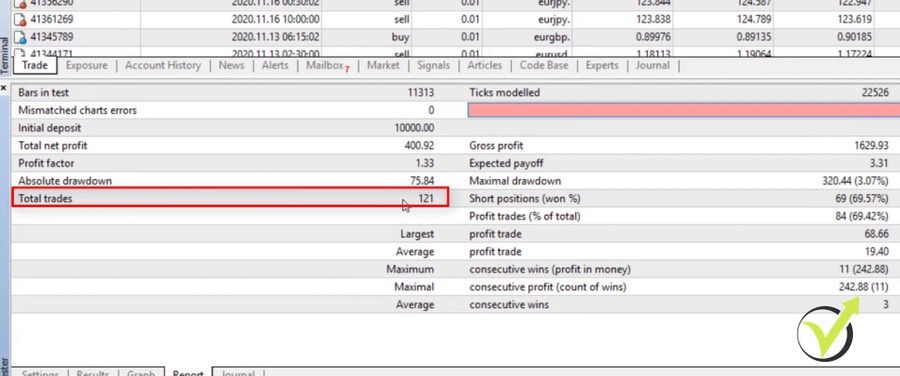
And why I have all the 121 trades is because I don’t have enough historical data on Meta Trader. 121 trade that happened in the past is not enough for me to consider this strategy as robust. Of course, I know it is robust because I have done the test on EA studio and I know that for many more count of trades the strategy is profitable.
But if you buy an Expert Advisor from the market and you test it on Meta Trader and see just 121 trades, you will be like, oh, I’m not really sure if this is a robust strategy. Because the strategy executed just 121 times and I’m not sure if it will work in the future. That is why we want to see a minimum 300 count of trades, 500 is preferable, more it is even better.
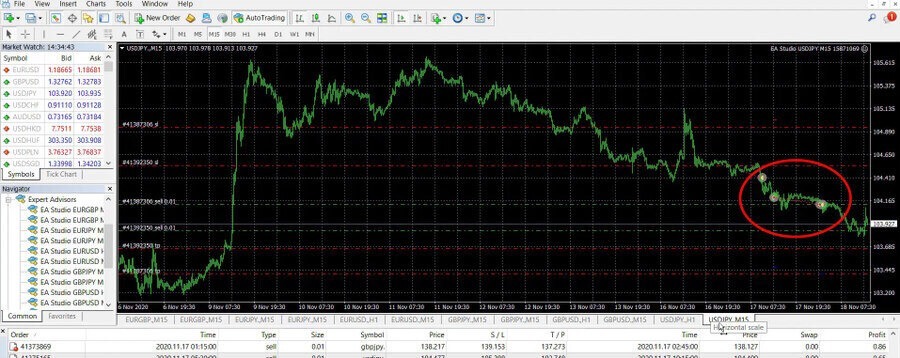
I continue about a week after I have placed these 12 Expert Advisors on a small Live Trading Account for the purpose of this course. And you can see that already I have a 15 USD profit, not a lot of profit for 5 days.
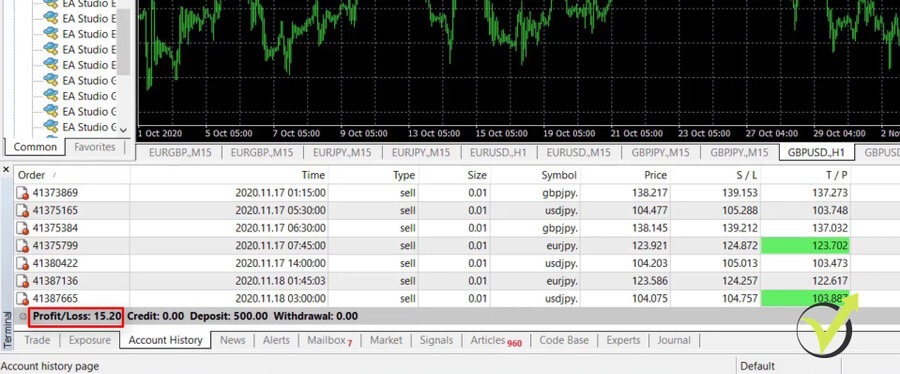
But as you notice, as time goes by, the profit gets a little bit bigger. We see all the trades that opened and closed. Some more Take Profits were hit, and 15 USD in 500 account is 3%. Not bad for 1 week.
Demo Account
And obviously, I have these Expert Advisors on bigger accounts. But, one more time, I wanted to show a relatively small amount for this course because I don’t want anybody to accept it as a recommendation. If I show a bigger amount, I don’t want anybody to feel like trading with a bigger amount. I want you to start with an amount you feel comfortable with. Of course, as I always say, start first with a Demo Account.
You saw how the backtest on MetaTrader works and how it looks. And now I will show you what’s different when we backtest Forex trading strategy with strategy builders. We did it for the USDJPY. Here it is. You see some nice trades, some short trades happened recently.
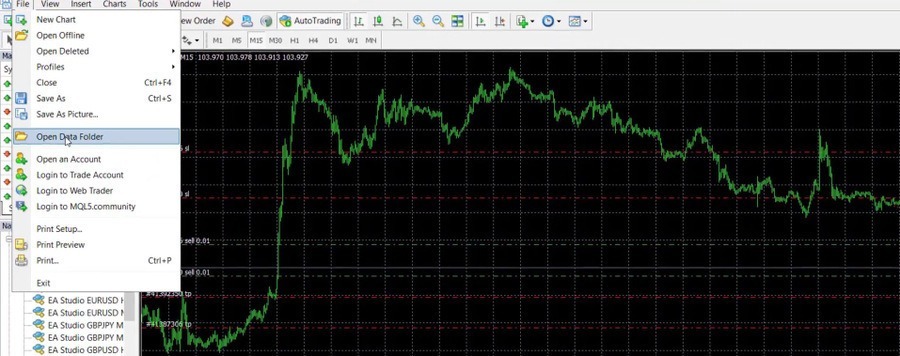
I will go to File, Open Data Folder,
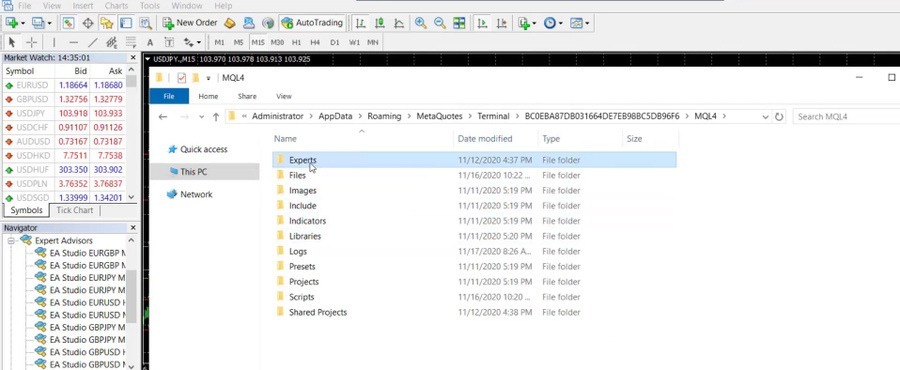
I will grab these Expert Advisors for the USDJPY. So I will click on Experts,
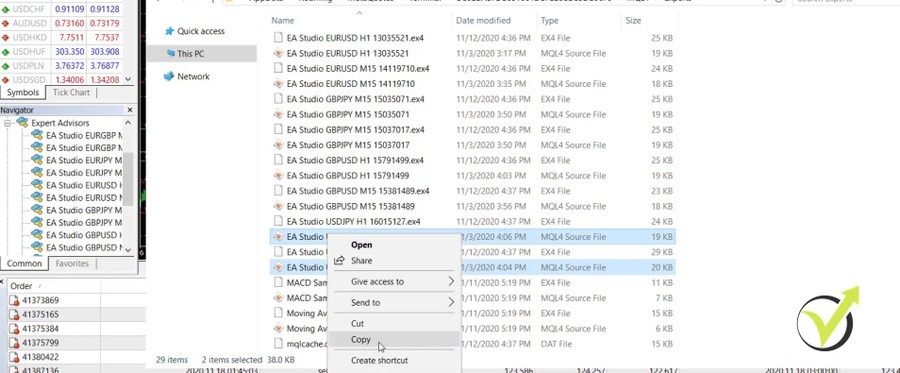
and I will take the 2 USDJPY Expert Advisors. Let us copy them and I will minimize the VPS.
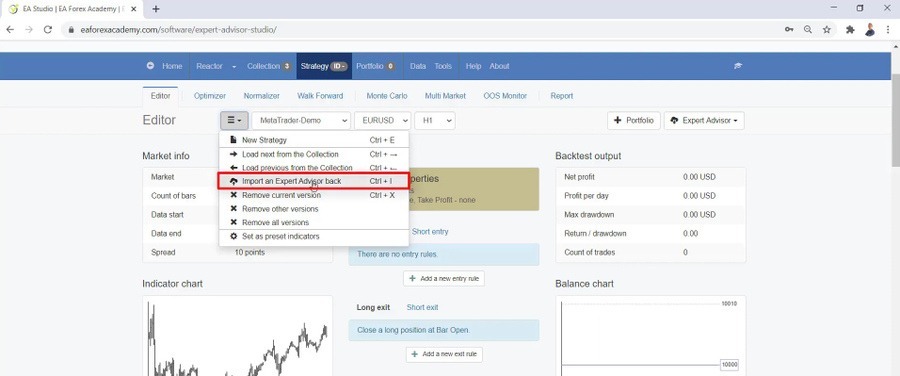
I have the Expert Advisor Studio with some strategies that I recently generated for the GBPUSD. But I will show you later on in the course how I am doing it. I will go to Strategy, and right into the editor we see an arrow where we can have a drop-down menu and I will go for the option to Import an Expert Advisor back or this is possible as well with the ctrl + I from your keyboard. I will just click on it.
Williams’ Percent Range
And on the folder that I have prepared before the lecture, I will paste the 2 Expert Advisors for the USDJPY. Here they are.
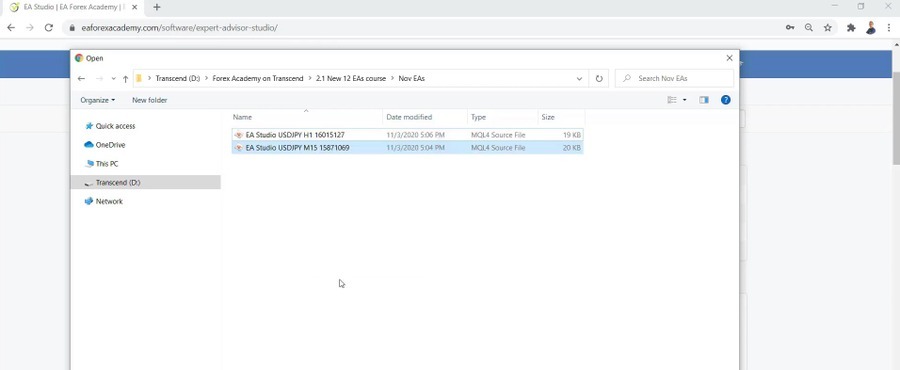
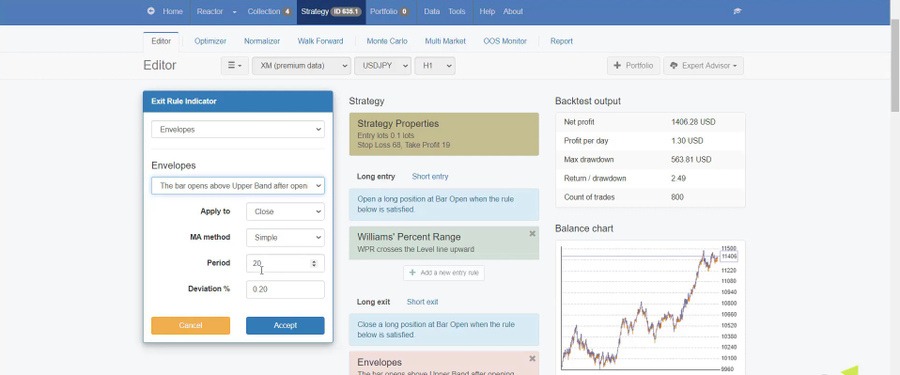
Let’s open the first one, for example, the one for the hourly chart. Click on Open and you can see what is the strategy behind the Expert Advisor.
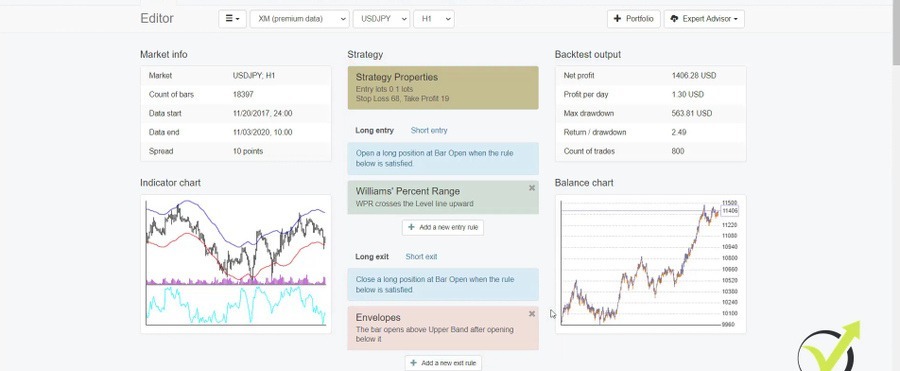
I will show you so much more statistics. You see what a balanced chart I have.
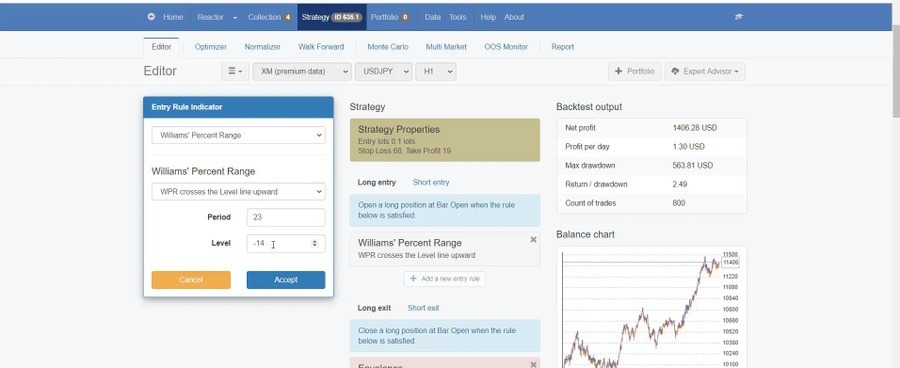
As well, you can see backtest outputs where we see the most important like profit per day, but that’s for 0.1 lot, maximum drawdown, return to drawdown ratio, count of trades. And in the middle, we see the strategy itself. Something we don’t see in the trading strategy backtest on MetaTrader. I have an entry rule with the Williams’ Percent Range. If I click on it, you will see that Williams’ Percent Range is the Indicator and the rule is Willams’ Percent Range crosses the level line upward, period of 23, Level of -14.
And I have an exit rule with the Envelopes and the condition is the bar opens above Upper Band after opening below it, and we have the parameters below.
What more do I have? I have the Indicator chart which is absolutely fantastic.
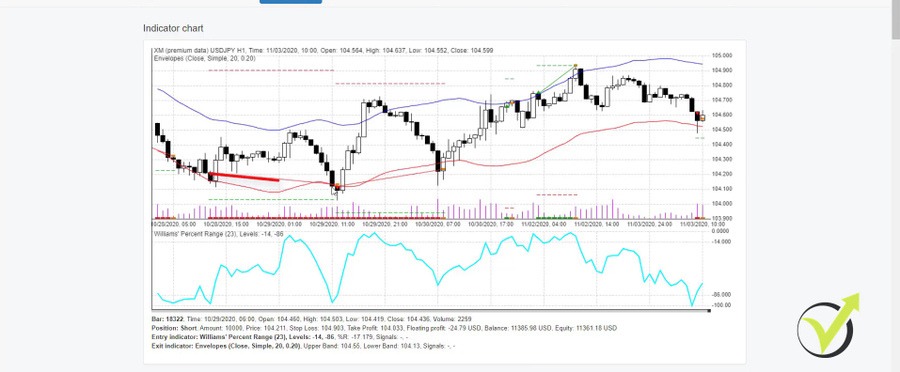
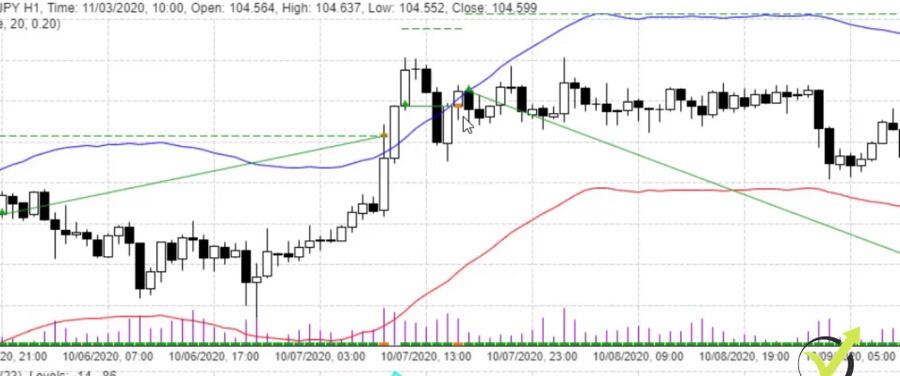
You can see where the trades were opened and closed exactly. And where we have short trades and long trades. So for example, when we have red bars or small lines, you can call them below the chart, it means we are in a short position. And for example, right here we have 2 long positions.
Take Profit and Stop Loss
So you see where the new bar opened according to the entry rule and where the Take Profit was hit. The green small lines are the Take Profit and below that is the Stop Loss.
So every strategy obviously has losing trades and don’t expect to find strategy only with profits. But, of course, we wanna have more profits than losses. And with strategy builders like EA Studio, it’s very easy to find such strategies. And I will show you later in the course. But let’s have a look, for example, at that trade here. The bar opened after we have the Williams’ Percent Range crossing the level line.
Then we have the Take Profit, Stop Loss is somewhere below. I cannot see it at the moment. And I have as well the exit condition, which in this case, I think applied right over here. With this trade, you can see the trade was open here. The Take Profit was not hit. I have the exit condition.
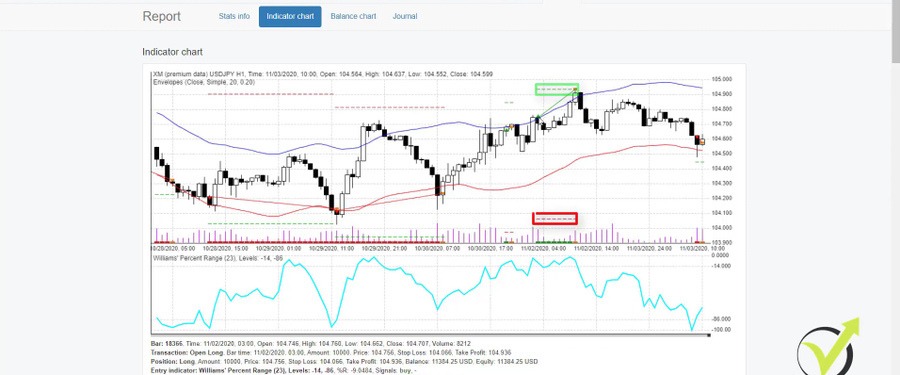
If I go back to Editor one more time and I click on Envelopes, the bar opens above the upper Band after opening below it, we have the bar that opened above the upper band after opening below it.
The Bollinger Bands
And this is actually a very interesting situation and example that I caught here accidentally. And I want to explain it a little bit more. So stay with me. This is very important what I will tell you in the next few minutes. Now, in manual trading, when you go back over the chart and you put the Indicators and you want to see how the strategy would behave, where is the trade, where the Indicators crossed, and so on, it is very tricky and misleading because the Indicators are repainting.
Now, at this moment right here, the opening of the bar was above the upper band and the opening of the next one is higher. What happened is just the Bollinger bands, it continued and it changed and when we look at it later, it looks like the bar was below the upper band. But the strategy builder, the software clearly shows that at that moment the bar opened above the upper band and not below it.
I will say it one more time. At that moment when this bar opened, the Bollinger band was below the opening point. And we see it above now because the Indicators repaint. They follow the price and they change after the price. So if I put the mouse exactly on the opening of the bar, I want you to focus on the values that we have below the chart. You will see that I have a bar with open price 105.988.
The Envelopes
The exit Indicator, which is the Envelopes, has upper band with value 106.01 which is the fixed value after the bar was closed.
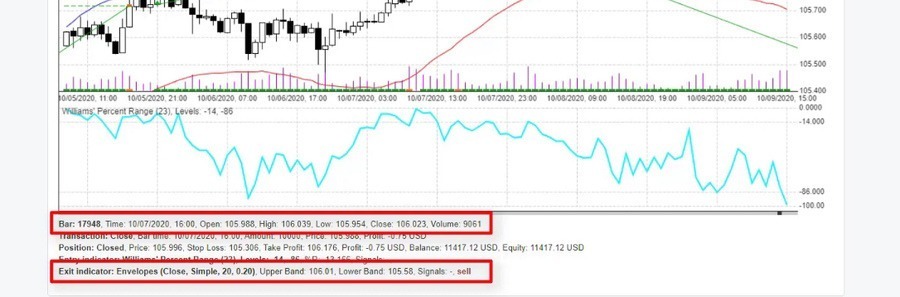
But at that moment when the bar was opened and the price went up and down for 1 hour, this value for the upper band of the Envelopes, it was moving up and down, OK, it was not 106.01 the whole time it was moving, it was changing. And at the opening of the bar, it was below the price of 105.988.
That value of 106.01 came later when the bar was closed. So what happened? The trade actually closed here, but if we go back and look at it, we will not see that we have the exit. So this is the huge, huge difference when we use strategy builders like EA Studio and this is the benefit to backtest Forex strategy because we see exactly what happened, where the trades were open and closed. You can see here consecutive profitable trades. Very beautiful.
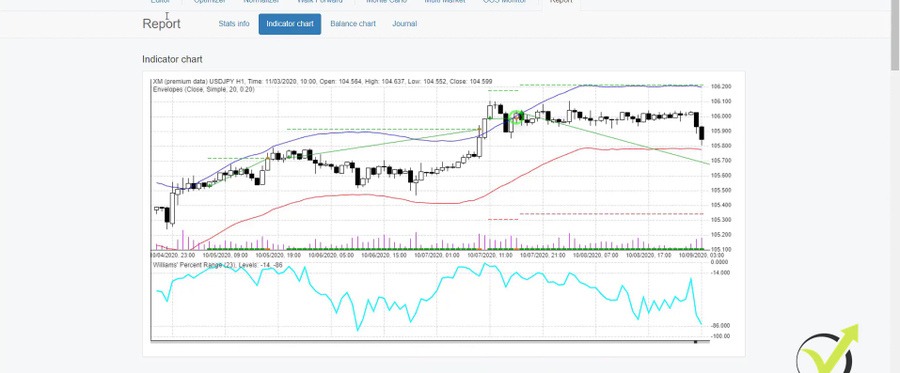
Long trades, another one, third one, fourth one, fifth one 5 consecutive trades on a profit. Very nice. And if I don’t have that and I just put the Bollinger band and Williams’ Percent Range on MetaTrader, and I look at the chart. I don’t know when this happened. I don’t know at any moment am I in the trade already or am I starting here? Should I exit here? You can see how hard it is. It is just on the upper band of the Envelopes.
Backtest Forex Strategy with EA Studio
Sometimes, it is so hard to understand the value of the Indicator, it is just a few points and pips, and here I can see very clearly that I had a trade opening. In this case, it was because of Williams’ Percent. Same thing with Williams’ Percent Range. You see that there is a cross. Sometimes it looks like a touch and you cannot be sure on the chart on MetaTrader whether there was a cross or not.
But if I put the mouse on it, you can see very clearly now that the Williams’ Percent Range level at this moment was -15.831. And the previous value was -10.484 which means that it was below the -14 and then it went higher.
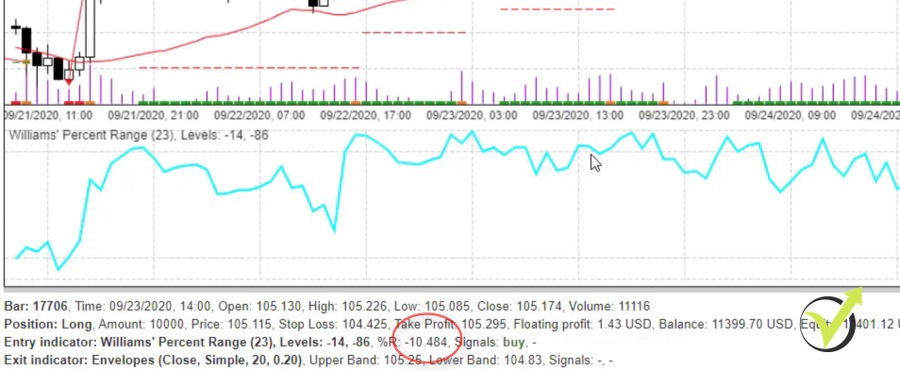
But sometimes it looks like a touch over the chart and you cannot understand what happened there. Was there a cross or not. And if you don’t backtest Forex strategy and if you don’t have the strategy builder, you cannot really understand how the strategy works.
You don’t know where the trades were open and closed, but with EA Studio especially, which I find to be the best strategy builder at the moment for the last 3 years, I can tell that this. It’s not just because we have integrated on our website, but because we have been testing all of the strategy builders out there, all of the software available. And obviously, I want to use the best one at every moment.
The most profitable trades
EA Studio is so much ahead of every other software. And that’s why we have integrated on the website. There is a free trial that you can take advantage of on the homepage. There is a free course as well. And in the next lectures, I will show you more about EA Studio, how I am using it, how many other traders are using it, how we generate and create new strategies, and how much easier is algorithmic trading with such a piece of software.
What’s more, statistic is not just the Indicator chart, the balance chart, and what we see right here on the Editor. But if I click on the report, you will see stats information which will give you so much more about the strategy.
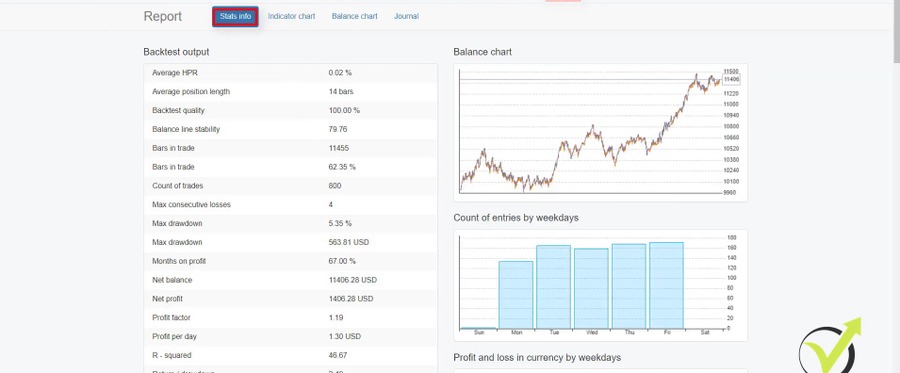
This is the backtest outputs. So you see how many things we have as information. We have the Balance Chart. We have the Count of entries by weekdays, Profit and loss in currency by weekdays.
So we can see when this strategy profits the most. Obviously, in this case, it is on the Thursdays. And if I scroll lower, you will see much more information and you can see the profits and losses by entry hour you will see the position profit by position holding time.
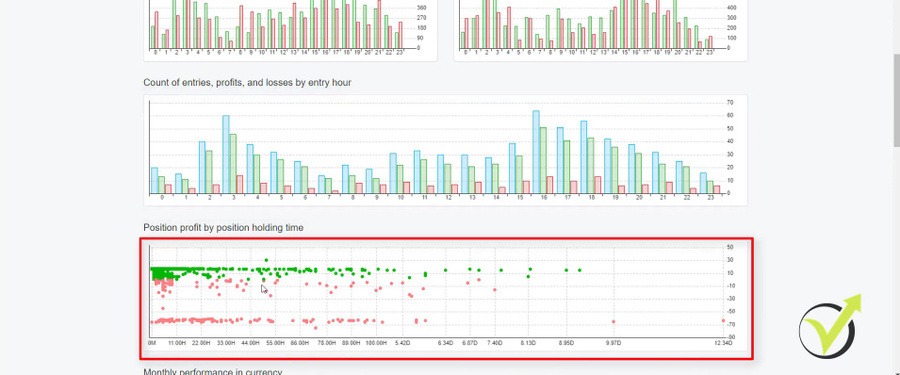
So what that means is that the most profitable trades are just in the first hours. You can see a lot of green dots over here and below we have monthly performance in currency so we can see back from, in this case, November 2017.
Risk Diversification
I have said it this way, just to have a look at it for the last 3 years. But you can notice that there are months of losses for this strategy. This period over here in 2018 was horrible for this strategy, but that’s normal. We always have profitable trades, losing trades. We have profitable months, we have losing months as well. But the idea is that with EA Studio we can have these kinds of strategies where we will have more profits than losses.
And when I trade a portfolio of strategies or I trade, for example, 12 Expert Advisors like what I’m demonstrating in this course, they compensate each other. When this strategy was losing in this period, the others were profiting. And this is exactly the risk diversification. And I’ve mentioned that I have selected to use 3 years of historical data to backtest Forex strategy, but if I go to data and I go to data horizon, I can increase it as much as I want up to 200 000 bars.
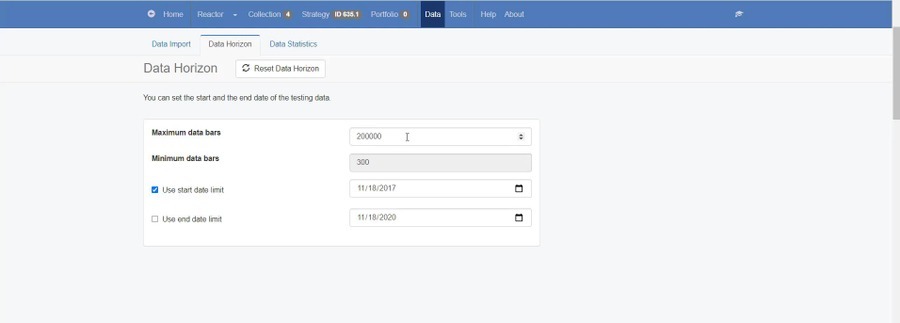
And this is because I’m using the premium data or this is the data from the Forex historical data app that I already showed, which is the best solution. And this data comes automatically in EA Studio, so I don’t need to download it. It is here all the time. All I need to do is to make it work for the broker that I have selected to use and in the next videos, I will show you how I’m doing that.
Take advantage of the 15 days free trial
So this is the difference between when we use EA Studio software and when we backtest Forex strategy on MetaTrader. Honestly said I’m not doing backtest on MetaTrader. I just show them in some of my courses when I compare the software and I compare MetaTrader, it’s a huge difference. But of course, that’s professional software. However, I will share some more of it in this course.
But if you don’t want to do it by yourself, no worries. I will include the already 12 Expert Advisors always. So you will not need to do it by yourself. All you can do is just play with it. Use the 15 days free trial. It has no obligations and you can export as many Expert Advisors as you wish. That’s the beauty – with 1 click I export the Expert Advisor. I don’t need to have programming skills. I don’t need to hire developers. It works with 1 click. This is why initially I took it.
Then after I saw its capabilities, I knew immediately that we needed in the Academy and everyone in the team uses it and now hundreds of our traders. And that’s why I’m sharing it with you. Let’s go for the next lecturers together and you will see more of the course and you will learn more about Expert Advisors.
Cheers, guys.