MACD indicator – the favorite indicator from the Oscillators
MACD indicator is one of my favorite indicators in trading too. Hello, dear traders! My name is Petko Aleksandrov and I continue now with the MACD indicator and the Oscillators.
What are the Oscillators?
These are indicators that show price deviation from its average value. So we have I think twelve indicators in Metatrader as Oscillators. So let’s see one, two, three, four, five, six, seven, eight, nine, ten, eleven, twelve. Actually, they are thirteen:
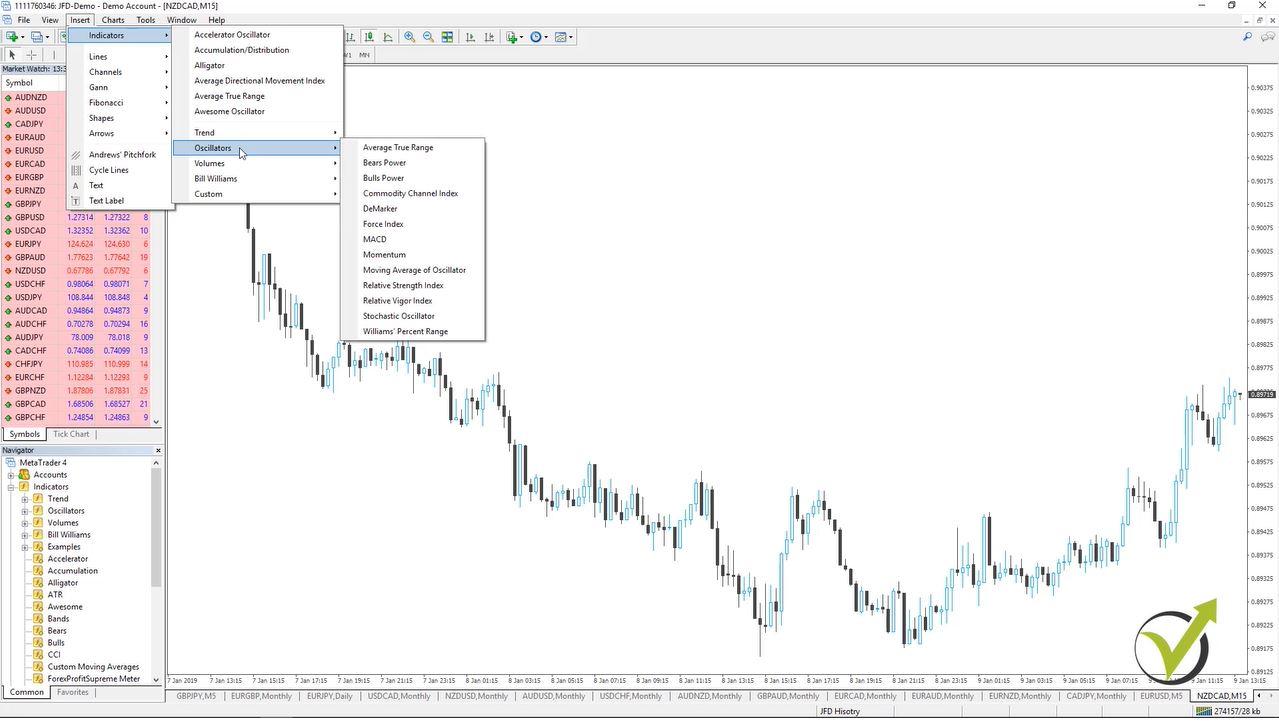
Alright, thirteen Oscillators. So probably here I will divide it into two parts, in two lectures. And I will go through each one of them. So you can have an idea, if you really beginner trader, you can have an idea of
- How does each indicator work?
- How we use it in trading?
And I’m not going to go into very deep details about each indicator because as I’ve said there are many different strategies with each indicator. And if you are interested in any of the indicators you can look for it online. You will find so much information.
I just wanted here in this course to give you systematically information about each indicator. So you’ll have an idea, and if you like any of those you can start using it or you can look for some more different methods of how traders apply the indicator.
The first Oscillator indicator and this is the MACD indicator.
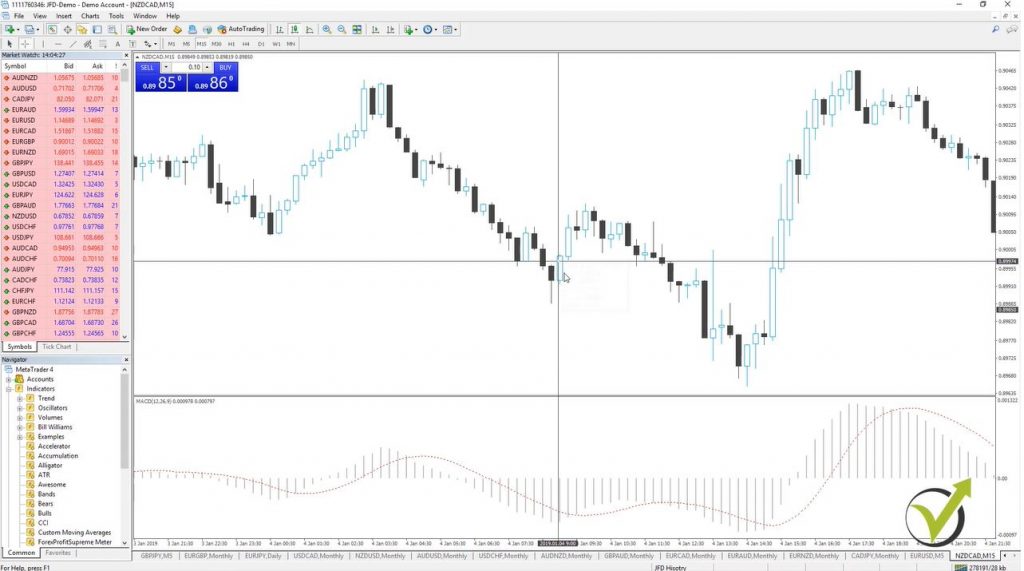
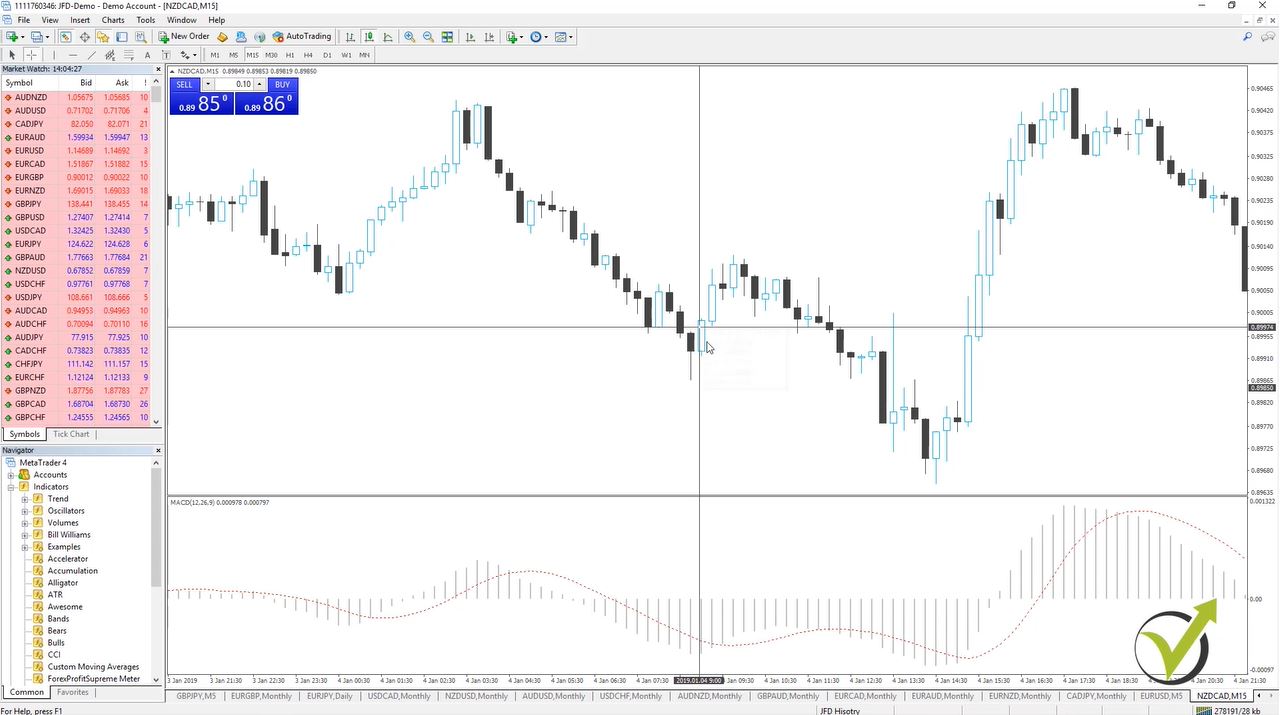
As well one of my favorite indicators in trading, in manual or Algorithmic Trading. It’s a really useful indicator. What we have here is the MACD line and the signal line. So the red line is the signal line and the MACD line is the line connecting these bars. So just imagine that you have a line over here it connects the bars and this will be the MACD line. And sometimes you will see two lines MACD indicator, but for Metatrader the default indicator is displayed just this way.
What signals gives the MACD Indicator?
- the divergence, which I have already mentioned to you
- it has the overbought and oversold areas
- as well one of the strongest signals is when the MACD line crosses the signal line upwards, this gives us a buy signal
When it crosses downwards it gives us a sell signal. And you see here, for example, we have very good examples right here, the MACD crosses. So here we might buy and then here we might sell and then here we might buy and here sell again and here buy again up till here and so on. And there are many different strategies that I was using.
Here I will give you a small tip that if I buy using the MACD indicator I would like to exit not on the opposite sell signal but when I see the first smaller bar than the previous one.
So for example, if I was going to buy over here on this cross the MACD crosses the signal line. I will buy here I would like to exit on this candle here and not over here on the next cell. Because you see I would probably lose my profit. And now if here I have the sell I would like to exit on the first smaller bar than the maximum one. You see they’re all getting bigger and bigger and bigger. And then here I have this smaller bar and you see this is just on the second candle that shows the end of this move here.
Now the MACD indicator was used as a solution of the moving averages.
First, it all started with one moving average, then the second moving average. So cross of the moving averages and then because two moving averages are not enough to have a good signal for entry the solution came as MACD or this is as well known as the Moving Average Convergence Divergence Indicator. And the MACD line actually is the difference between the 26-period and the 12-period exponential moving averages. And we have the signal line, which is a nine-period moving average of the indicator, okay, of the MACD indicator.
The second Oscillator, that we’ll go through is the Average True Range.
This indicator shows volatility on the market. When the indicator is at a low value, meaning that there is no volatility, you can see here the market is at a range, and below the ATR or the Average True Range Indicator is with very low value. And when there is some volatility you can see the price drops then the indicator goes upwards.
So no matter if the price drops or it rises the indicator goes higher whenever there is volatility. This is quite different from what we have with the MACD indicator. And most of the time you will recognize that when the price falls it will rise extremely because normally this is called panic on the market and normally the price always falls faster than it rises. Because this is a result of emotions in most of the traders’ investors. When they panic they sell it off and the price drops dramatically. So most of the time the ATR rises when there is a sell-off. When the price falls down.
I will remove none of this indicator from the chart and I will go to the next one. I click on insert-indicators Oscillators and the next one is…
The Bears Power
You will see the Bears Powers is represented in bars that are just below the zero line and that are above the zero line.
This indicator was created by Aleksander Elder and it was presented at his book “Trading for a living”, I do believe was the name. And he described it there as a constant battle between the buyers and the sellers every day. Because normally what we see at the moment for any price we can say it’s that a great price for the moment between the buyers, those who want to buy, and those who want to sell. And we can say the price is just where it is right now because this is where the buyers and the sellers agreed. This is where they meet, we can say it this way.
So Mr. Elder developed this Bear Power indicator as a difference between the lowest price and a 13-period exponential moving average. As you see I’m using here the default 13. So the indicator represents the difference between the lowest point and this 13-period moving average, actually exponential moving average.
Normally this Oscillator indicators is used together with some trend indicator. Also, MACD indicator could be used as trend indicator.
With simple eyes here we can see that when the price is going down we are below the zero line and when there is some kind of reversal, you can see we have the bars above this zero line, and when the price is in a range it goes above the zero, below the zero, above the zero. And this is where you will struggle. So that’s why it’s good to combine it with some trend indicator. Such as a moving average just to confirm the trade direction.
Alright, guys, I will remove this indicator as well.
I’ll go to the third Oscillator that we will have in this lecture.
And the third one is the Bulls power. After the Bears power, we will have the Bulls power.
Which is developed again from Mr. Elder and it’s just a very opposite, I can say, it is the difference between the highest price and the 13th-period exponential moving average. And for this indicator, he says that the highest price displays the maximum buyer’s power within the day. This is when we have a maximum fourth day or when we have a minimum. This is the maximum power for the buyers on the top and for the sellers on the bottom.
Тhe Commodity Channel Index
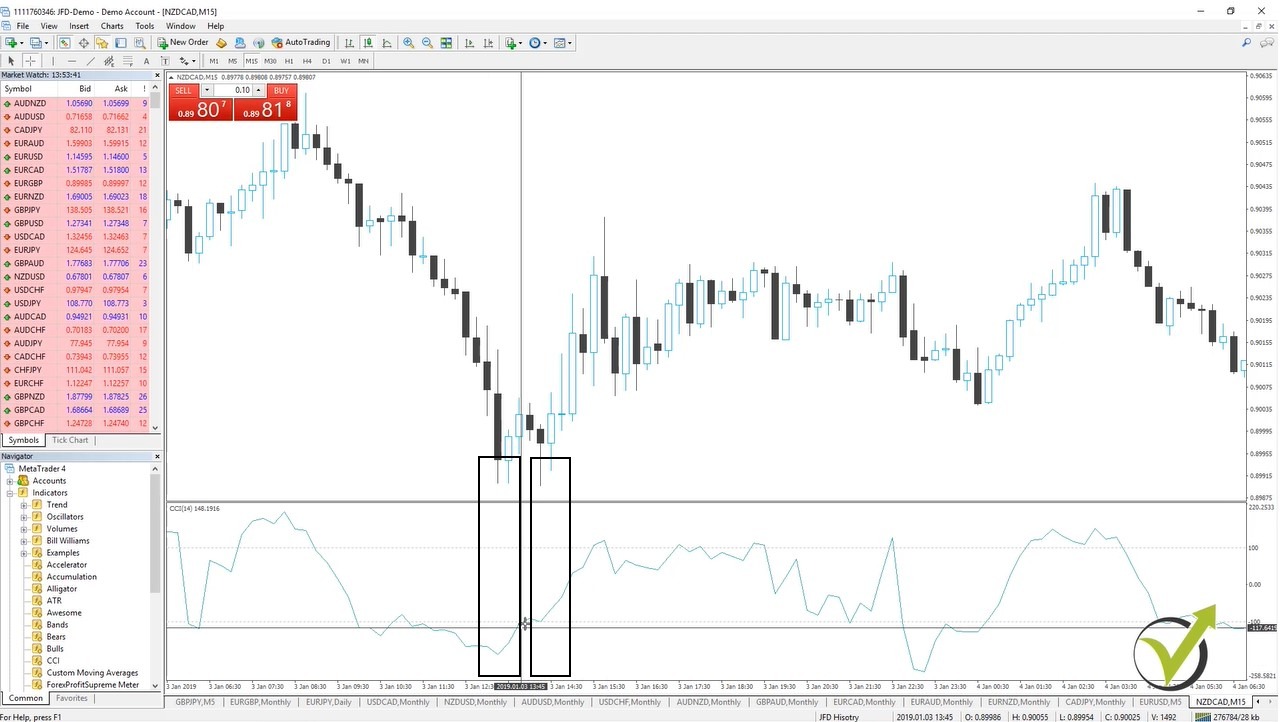
I will click on OK and you see here we have two lines we have the zero level and on the top, we have the 100 and below we have the negative 100 level. This indicator as well is known as the CCI indicator. And normally the traders use the CCI by looking for divergences.
So what is the divergence?
Just as we have it with the MACD indicator. This is the situation when the price reaches a new maximum, let’s say a new bottom. And the CCI fails to have a lower bottom. A lower low than the previous one. Same on the other side on the top, the price reaches a new maximum but the CCI fails to have such a maximum. I will just look for some examples. Let’s have a look at this example. I think this is a good example here. So you see the price goes down, it falls as well. The CCI is going down. It has this lowest point here. Then the price makes another lowest point. You can see this low is lower than this low, I will take the crosshair to make it easier.
So here we have the first low. Then the price makes another low, lower than this one, but the CCI you can see makes a much higher low than the previous one. This is called the divergences here and it gives us a signal that the price might change in direction. And you see after this fall the price went higher. And as well the CCI is used for overbought and oversold situations.
If the line is above the 100 we say the market is overbought, if the line is below the negative 100 we say the market is oversold.
We can expect change at any moment. And when we combine the divergence with overbought and oversold we have better signals as in this case you see this divergence situation is outside the negative 100 and 100 range. So in the oversold or in the overbought areas, we have much stronger signals.
Alright, so this is the CCI indicator. I will remove it from the chart and I will proceed to the next Oscillator indicator, which is…
The DeMarker.
I will click on okay and you see it displayed here very very similar to the previous one, as an outlook. But you can see it is between zero and one and we have two lines of 0.3 and 0.7. With simple words for this Oscillator indicator is that it compares the maximum for the current bar with the maximum of the previous bar.
For this indicator, we can say that when the price is above 0.7 line we might expect that the price will reverse downwards and again when the price is below 0.3 we might expect that the price will go higher.
And I will continue with the next Oscillator indicator and this is the Force Index.
It is right over here I will click on OK and you see again it is displayed below. So probably you have already noticed that all Oscillators are displayed below the price. They are not over the price but in a separate window below the price.
What we can say about the Force Index?
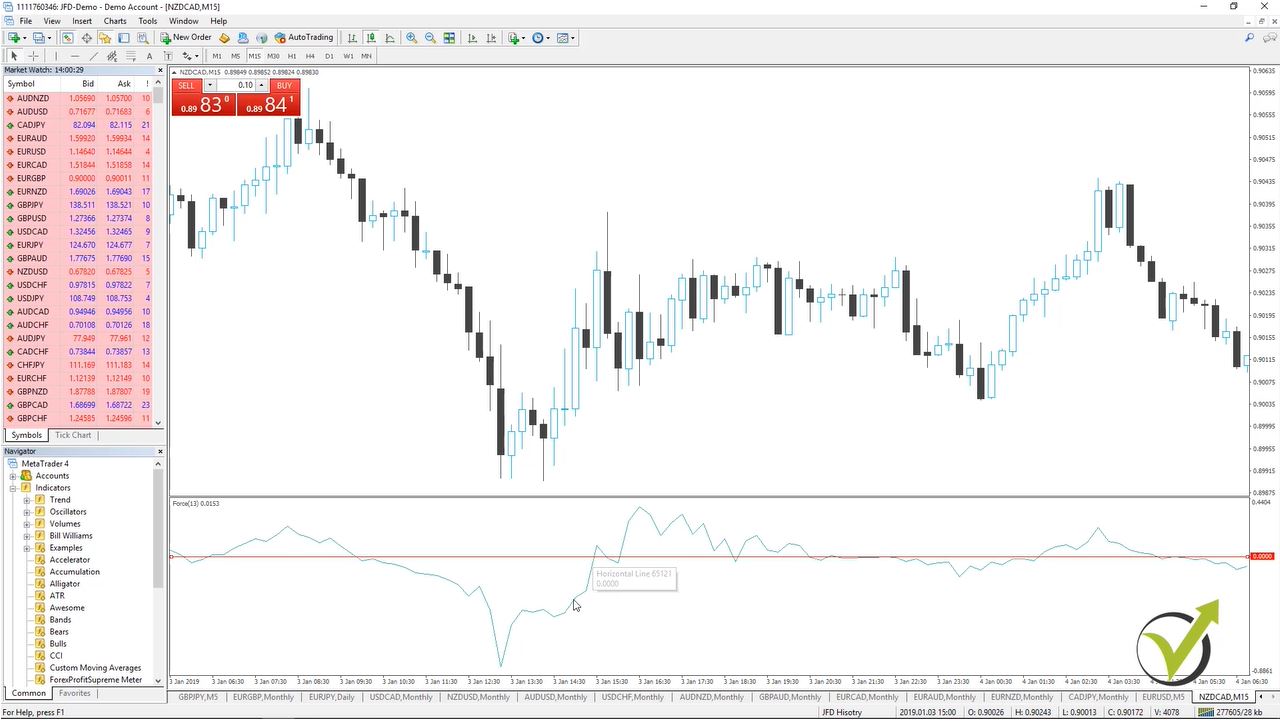
The first thing that it shows is that we might want to buy when it’s negative because you see there is a zero line here as well. And we would like to sell when this Force Index is above zero. And actually, the signal that is giving by the Force Indicator is when this line crosses the zero line. So let me put the line on the zero. I will need to double click on a tab go to horizontal line properties and for value, I will select zero. I will press on OK and you see it’s exactly there.
So the sell signal comes when the Force Index line crosses the zero line upwards. This gives us a sell signal and when it crosses on the other side it gives us the buy signal. This is how usually we use this indicator. Looks simpler to MACD indicator but the signals it provides should not be underestimated.
So this will be the first part of the Oscillator indicators. In the next lecture, I will continue with the rest. And if it is your first time looking at these indicators you might want to test placing them over the chart and see how they look and just roll around with your crosshair to notice how each indicator reflects the change of the price.
Personally me when I was starting trading I was spending so many hours just to look over the chart to place different indicators and to look for the moments when I would like to enter on the market and when I would like to exit. And actually most of the strategies that I’m using nowadays I have created those in this way looking and observing the market.
Okay, thank you for reading and I will continue with the next article with the rest of the Oscillators.
This lecture is free from the course called MetaTrader 4 Forex platform: Start trading with a pro trader
If you have any questions don’t hesitate to ask me or you can write in our trading forum.
Cheers!