Forex Monte Carlo – one of the greatest robustness tools in algorithmic trading
Forex Monte Carlo turns out to be a preferable tool from most traders using strategy builders. Hello, dear traders, it’s Petko Alexandrov from EA Forex Academy and in this lecture, I will continue with the Monte Carlo robustness tool that we have in Expert Advisor studio. So let me get into it. I have some strategies here that are memorized into the collection, I will remove them.
The Forex Monte Carlo, you can find it right here, just below strategy when you click on “strategy”. But I don’t have any strategy at the moment. So let me generate quickly some and I will stay with USDCAD and M15.
I will have the range from 10 to 100 for Stop Loss and Take Profit. And as generator settings, here let’s use the Acceptance criteria in this case. I will click on it.
You can add different criteria when generating strategies
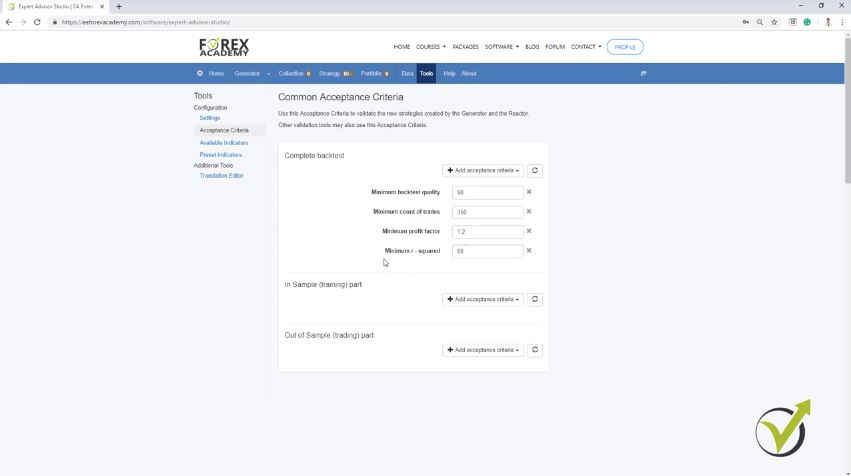
And here, I will add some criteria for the complete backtest. Now if you’re using In Sample and Out of Sample you can add different criteria. This is what I was talking about in my previous course for the top 10 AUDUSD
Expert Advisors.
But here I will not use it. I will put some criteria for the complete backtest so I always start with minimum backtest quality and I keep it on 98. So this is the criteria if our historical data is fine and what is the backtest quality.
Before it was called Ambiguous Bars. So here the software detects the bars or the Candlesticks that we have in Meta Trader. Where, for example, we have an entry, OK?
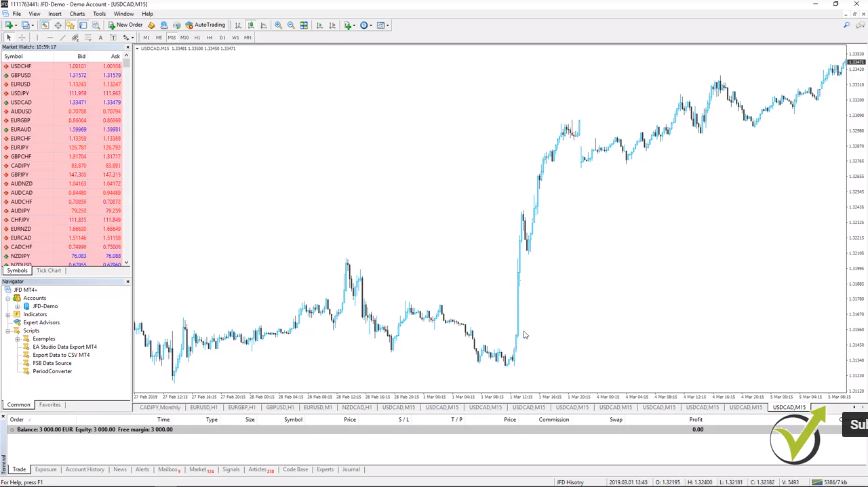
Let’s say on the opening of this bar, let me zoom it or any bar doesn’t matter really, on any bar. We have the opening,
for example here and then we have a Stop Loss and then we have a Take Profit. And with Meta Trader, we have the opening, the high, the low and the close.
These are the four values. But we really don’t know what happened inside the bar. And if we have such a bar, where we have the Stop Loss and the Take Profit within this bar, the backtest will take it as a negative as it was hitting the Stop Loss.
Backtesting with Meta Trader takes Take Profit.
Now the difference when we are doing backtest with Meta Trader is that it will take Take Profit. OK? It will give it a more positive result which I really don’t like because I prefer to see the negative result instead of the positive result. Because if we have many bars with the strategy, this one, for example, here or anywhere else and our backtest shows us that it always takes a Take Profit, obviously this could be misleading and it could be the case that it will hit the Stop Loss more. OK?
So Meta Trader takes the positive and EA studio here is skeptical and takes the Stop Loss, which I believe is the better method as well. So we can say that we see a more skeptical result for the strategy while backtesting it.
Anyway, I keep it minimum backtesting quality 98 and I will add Minimum count of trades, what I was talking about earlier. I want to have at least 350 trades. So each strategy that will be generated, I want to see at least 350 trades executed in the backtest. OK?
I will add as well the Profit factor, one of my favorite criteria and I will increase it to 1.2. So the Profit factor, for the newbie traders, this is the ratio of the Net profit versus the Net loss. And then I will set the minimum R-squared, something new with the Strategy Builder, which I really like to use and for example, here I will go with 60.
Find out more about R-squared in our forum.
Now R-squared is a little bit more complicated. For more information about it in our forum, let me just show it quickly to you. There is one section called EA Studio Updates.
When I click on it, you will see here some videos and explanations about the R-squared and about some other features. This is about the backtesting statistics and you see there are many commands. And I explained in details about the new features and let me just show you where the R-squared is.
Right here on the second page. So this is a video if you click on it, that you can watch for free. And below, are explanations.
So in simpler words, the R-squared gives us the equity line that is very close to such a regression line. And the higher the value we have for the R-squared means that we have more points on the line. The more the equity line is far away from the line or we have a dramatic Drawdown or so on, then we will have a lower R-squared.
But here, it’s in details and for me it’s very interesting especially if you want to analyze your strategies in details. OK? So you can read it here in our forum. It’s free and you can learn more about it. OK?
What is a good acceptance criteria to use in Forex trading?
- the minimum backtest quality,
- minimum count of trades,
- the minimum Profit factor
- and the minimum R-squared.
The Acceptance criteria filter all strategies with regard to what you select.
Now going back to the generator, I will press on “Start” and you will see now what the difference is. I have many strategies calculated.
You can see 100s of strategies calculated, but still, no strategy is shown. Because it filters all these strategies with these Acceptance criteria that I have selected over here. Alright? I will explain about the Forex Monte Carlo.
I had one strategy already calculated. OK? So I will take it as an example. I will click on it and you see this strategy uses Moving Average, Force Index for entry conditions and the Bollinger Bands as an exit condition.
We have a Stop Loss and a Take Profit and here is the Balance chart. Alright?
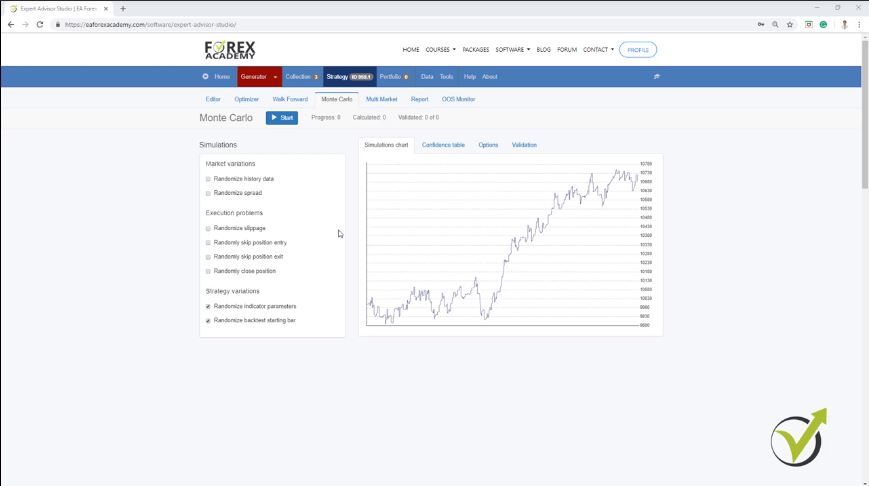
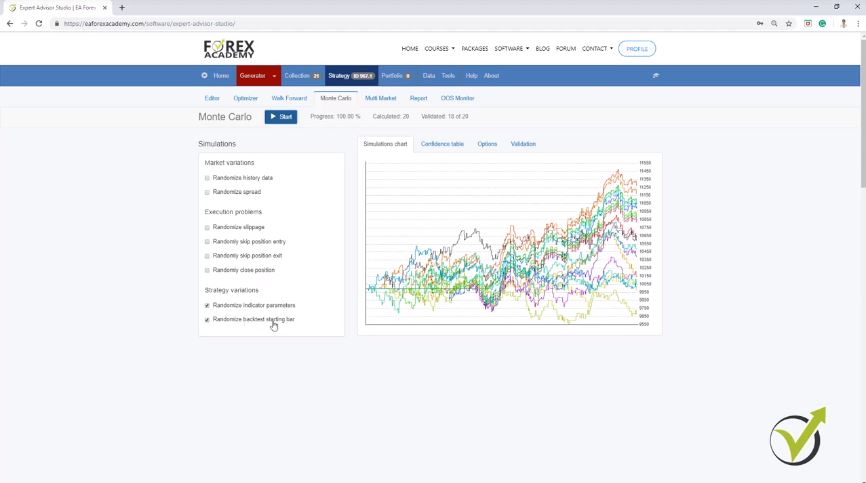
What are the different simulations in the ForexMonte Carlo?
- market variations,
- execution problems
- strategy variations.
So we can say this is a simulator.
The Forex Monte Carlo conducts various backtests with different variations.
On some places you can see it as Trading Simulator or Forex Trading Simulator, basically, what it does, it performs a variety of backtests with different variations. Now I like to use the strategy variation. So randomized indicator parameters, which means that the software does exactly the same what I showed to you on the Meta Trader.
Where I was changing the parameters for the indicators and I was doing a backtest. OK? Randomized indicator parameters. One more time it will perform different tests, different backtests, with different parameters, with randomized parameters.
And normally when I run the Monte Carlo, I want to see at least 80% of the simulations to be profitable. Now let’s concentrate only on this one, randomized indicator parameters. I will click on “Start” and you see that this strategy had 15 out of 20 validated tests.
So this is below my criteria of 80%, which would be 16 out of 20. OK? You can see here are the results for the different backtests that were made. Now you can set it in options.
In the indicators, you can set the change for the parameters.
You can set what would be the change for the parameters, in the indicators, the deviation range in steps. I keep it here as a default. OK? I really don’t touch these things guys, because they are set in a very nice way and I have tested it a lot and for me, it was just fine, if it is in this way.
Of course, you can play around with that but I’m not going into details. It’s a little bit more complicated. And it’s not really the subject of this course and I want to keep it simple.
And I want to explain what is most important in this robustness tool. OK? Now if I go to random backtest starting bar, it will perform a variety of tests that are starting from a different point in the past. OK? They will not start from the 16th of October 2017, but they will start later on. OK?
And if I click on “Start,” you will see what happens. The starting points are here, here in this range. And you can see that actually, the strategy continues to perform well.
We test the Expert Advisors over the historical data when creating them and combined with the Forex Monte Carlo.
It doesn’t matter when we will place it on the chart. And this is exactly the point of having this test. Because when we create the Expert Advisor, we test it over the historical data.
But we will place it trading on the Meta Trader in a future moment. And here this simulation shows us that, it doesn’t matter when we will place it on the chart, it doesn’t fail. OK? Even if it was placed on a different moment from the one that we used while generating the strategy.
And actually, these tests prove something very important, that this strategy is not over optimized for this period of time. Because if the generator over optimized it, exactly from starting here, let’s say in October 2017 till the moment, it found these best parameters exactly for this period of time. Then here with this test, I will see a dramatic loss when the strategy starts somewhere over here, in a later moment from this moment here. Alright?
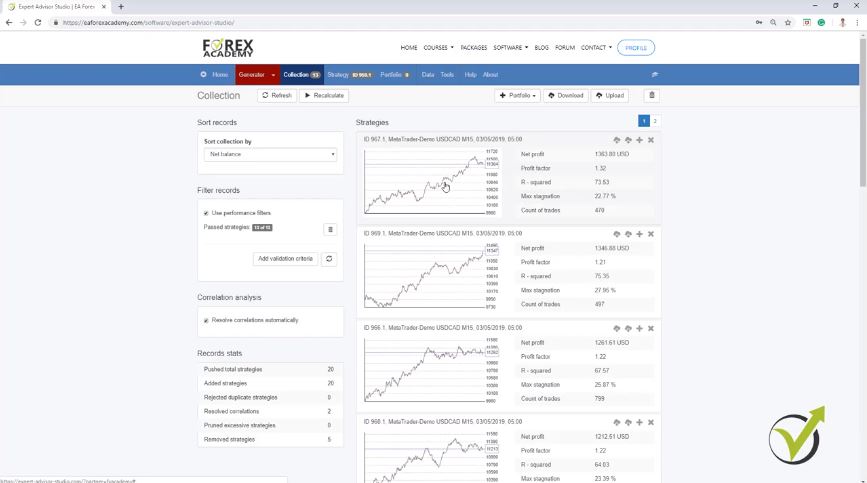
And let’s take some of the other strategies because you can see many were generated. Some with very nice equity lines. I will click on this one and let’s go to the Forex Monte Carlo. I will perform these 2 tests and I click on “Start,” and you can see I have 17 out of the 20. Alright?
So here, I get a little bit more positive results. And this is exactly what I want to see. OK? Strategies that are robust or having simulations with randomized indicator parameters and we’re having simulations with different backtests starting bar. OK?
Use a randomized history data in Forex Monte Carlo when having problems such as a floating spread, historical data problems, etc.
Now above we have market variations, which means a randomized history data, randomized spread. If your spread is floating a lot, you can check and perform robustness with the spread. So if I click on “Start,” you will see that this strategy keeps performing well, even the spread is a little bit different.
Now if I have a randomized history data, I will click on “Start,” again the strategy performs well. This normally is used if you have problems with huge spread or floating spread or you have problems with your historical data. And then you have execution problems like randomly skipped positions, randomly close position.
It will perform you such tests and simulations to see how the strategy will perform if you randomly close position. Now I don’t test this, because simply in algorithmic trading, my goal is to do it 100% fully automatically. OK? I don’t interfere with the Expert Advisors, I don’t close the positions and I don’t remove them from the charts for no reason.
Change your broker if you’re having execution problems.
So I don’t test these execution problems. And if you have execution problems with your broker, like huge slippage or they close your positions for some reason, then you better change your broker. OK? So these are the 2 Monte Carlo tests that I am doing, these 2 simulations which are very interesting to me and for me they just make sense because they change the parameters for the indicators.
And using the last one, we tested the Expert Advisor or the strategy, if it has started at a different moment. Alright, guys? This is the Monte Carlo, you can see how many strategies are already generated, some of them with very nice backtest output and very nice equity lines. So this is about the Forex Monte Carlo, very useful analytic tool that we have with EA Studio.
If you have any questions don’t hesitate to ask me in our forum. If you see this for the first time I’m sure it’s a little bit more complicated, but if there is something unclear really don’t hesitate to ask me. I will answer any question.
Thank you for reading and I will see you in the next lecture.
Cheers.